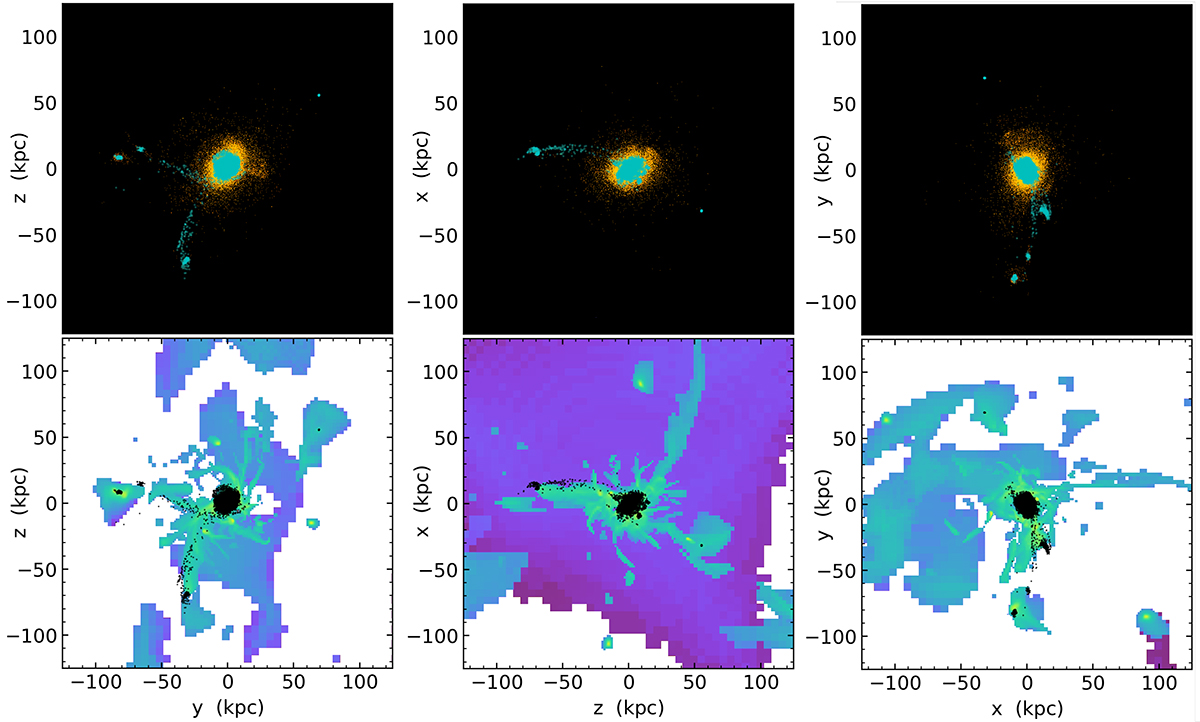
Fig. 5.
Download original image
Blue streams in the GARROTXA cosmological simulation of a z = 0 MW-mass galaxy, observed at z = 1.5. Top panels: total stellar surface luminosity. Bottom panels: projected cold gas density (T < 5 × 10⁴ K): green-yellow are the high-density gas regions; blue-black are the low-density regions. The cyan dots (left) and black dots (right) show the position of the star particles younger than 350 Myr.
Current usage metrics show cumulative count of Article Views (full-text article views including HTML views, PDF and ePub downloads, according to the available data) and Abstracts Views on Vision4Press platform.
Data correspond to usage on the plateform after 2015. The current usage metrics is available 48-96 hours after online publication and is updated daily on week days.
Initial download of the metrics may take a while.