Fig. 7
Download original image
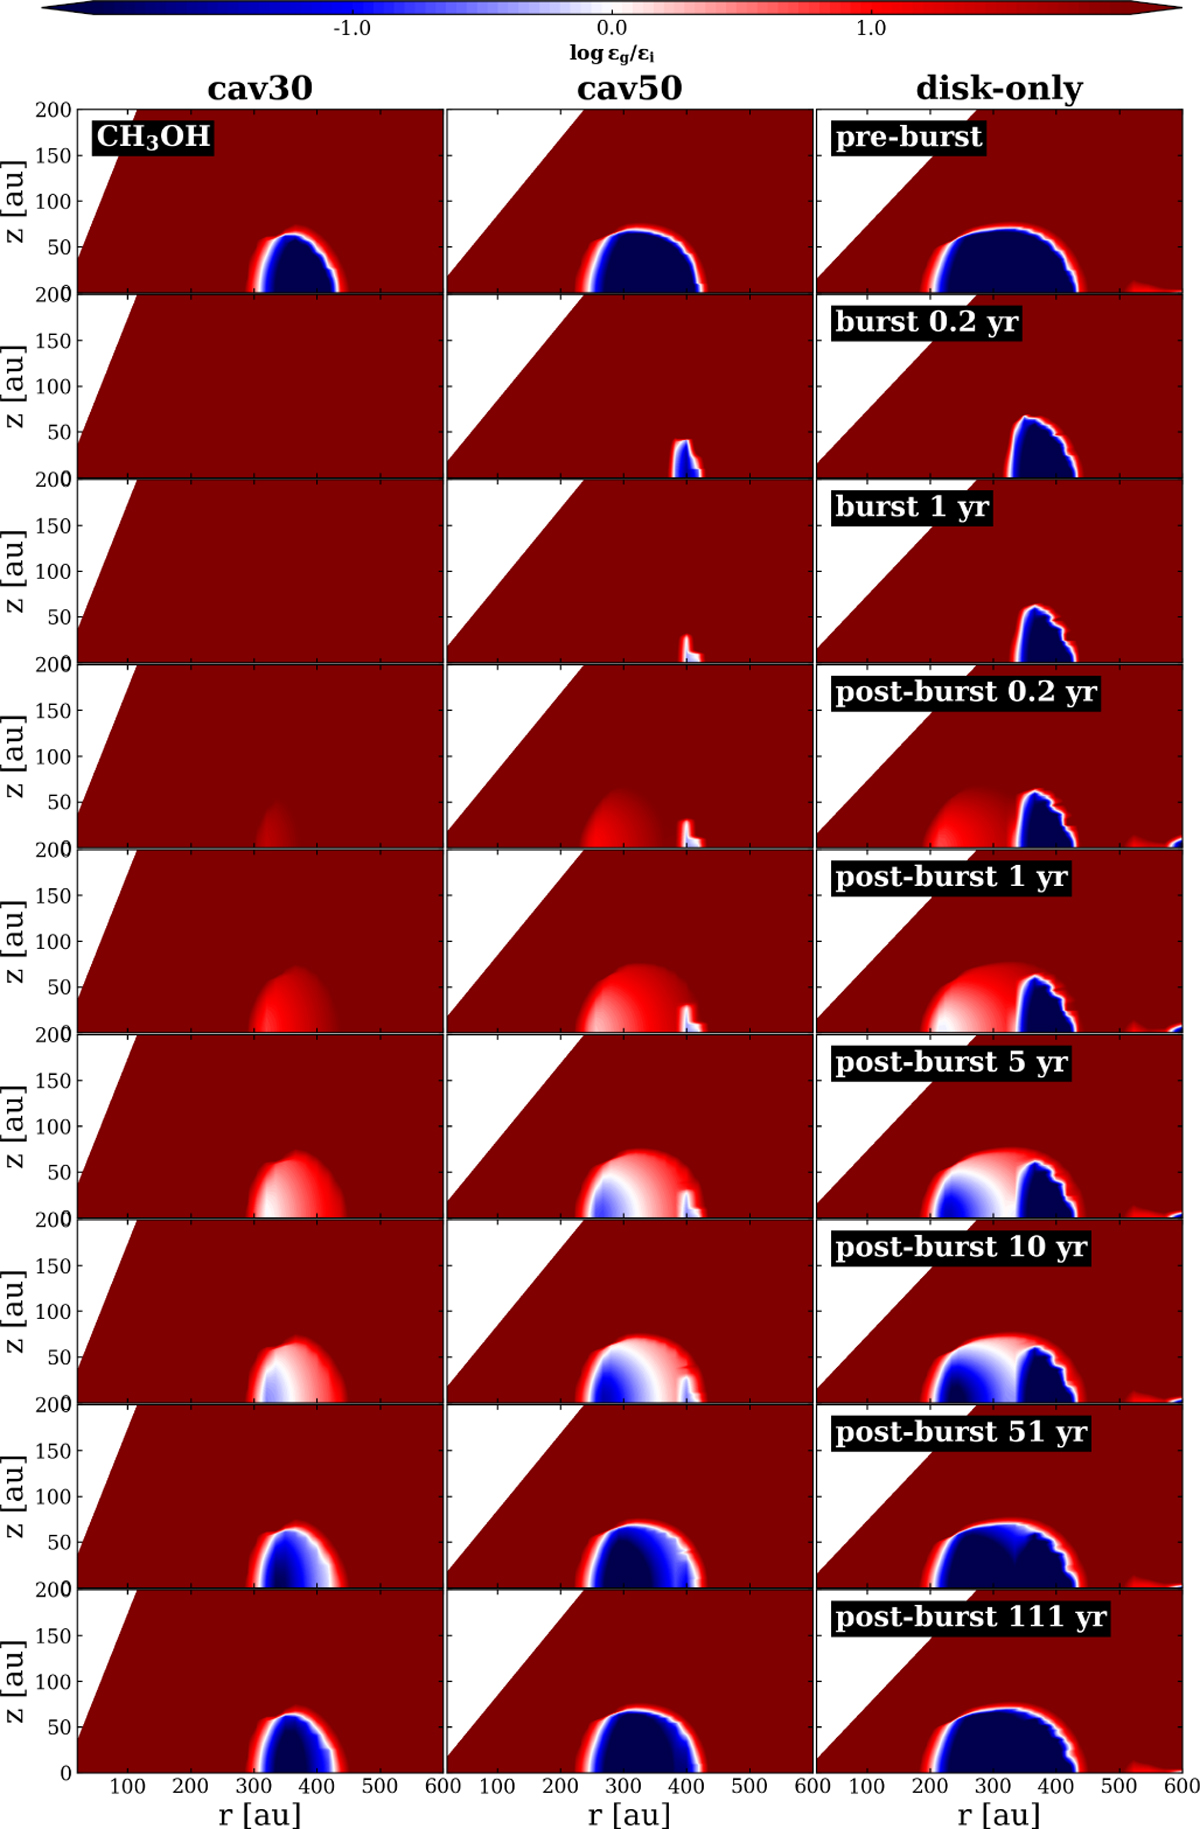
Ice-to-gas methanol ratio as a function of radius and height of disk. The blue and red regions correspond to the regions dominated by ice and gas, respectively. The white regions inside the disk represent the snow surface that encloses the snow region of the disk. The left, middle, and right columns represent cav30, cav50, and disk-only models, respectively. Each row stands for a snapshot in their evolution before, during, and after the burst.
Current usage metrics show cumulative count of Article Views (full-text article views including HTML views, PDF and ePub downloads, according to the available data) and Abstracts Views on Vision4Press platform.
Data correspond to usage on the plateform after 2015. The current usage metrics is available 48-96 hours after online publication and is updated daily on week days.
Initial download of the metrics may take a while.