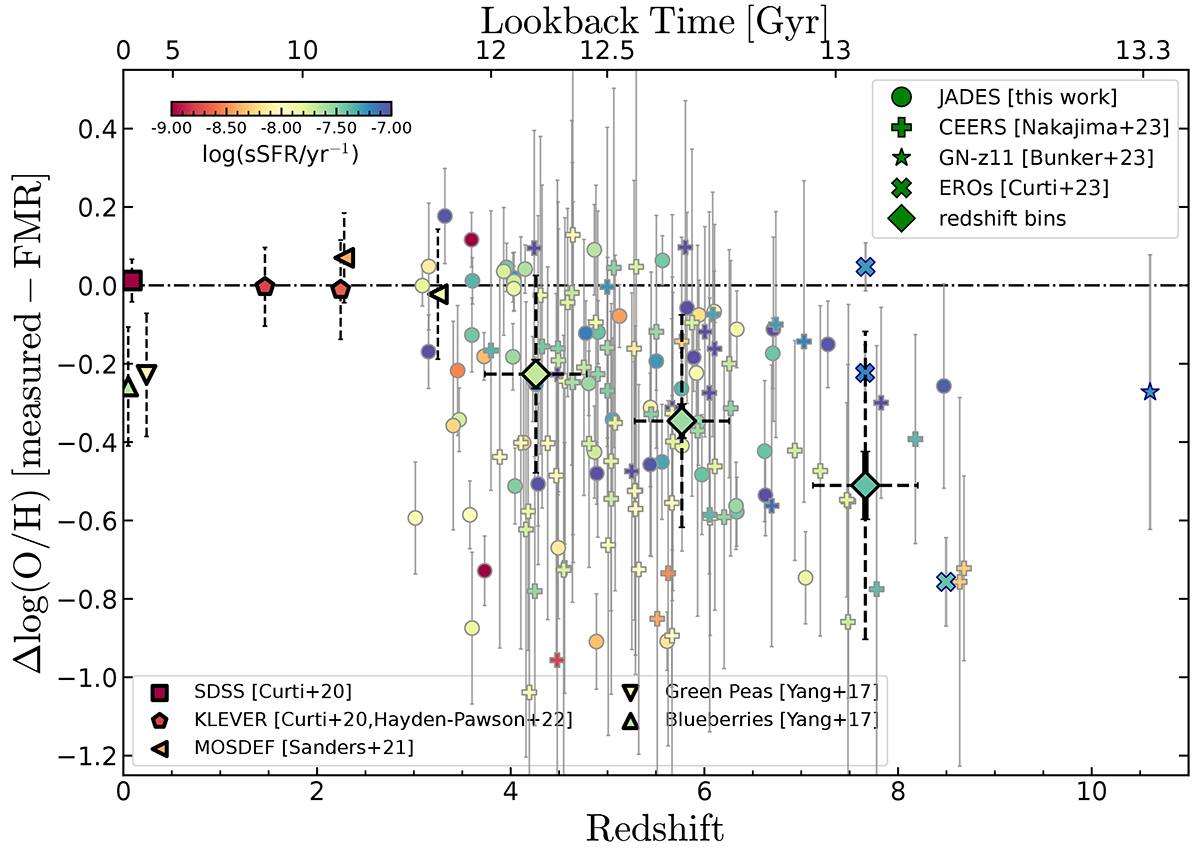
Fig. 7.
Download original image
Deviations of the JWST sample from the predictions of the local FMR plotted as a function of redshift. Marker symbols are as in Fig. 5, with each galaxy colour-coded by its sSFR. The weighted average of the deviation in three redshift bins (colour-coded by the mean sSFR of the binned sample) for both the JWST sample and for galaxy samples at lower redshift (SDSS at z ∼ 0, KLEVER at z ∼ 1.5 − 2.5, MOSDEF at z ∼ 3) are marked by larger symbols. Dashed error bars report the dispersion in Δlog(O/H) of each binned sample, whereas thick, solid bars report the standard error on the mean (which is often smaller than the marker’s size). Overall, z > 3 galaxies observed by JWST are scattered across the local FMR predictions, but show evidence of being preferentially offset towards lower metallicity values than expected with increasing redshift, with an average offset of −0.4 dex at z > 6.
Current usage metrics show cumulative count of Article Views (full-text article views including HTML views, PDF and ePub downloads, according to the available data) and Abstracts Views on Vision4Press platform.
Data correspond to usage on the plateform after 2015. The current usage metrics is available 48-96 hours after online publication and is updated daily on week days.
Initial download of the metrics may take a while.