Fig. 20
Download original image
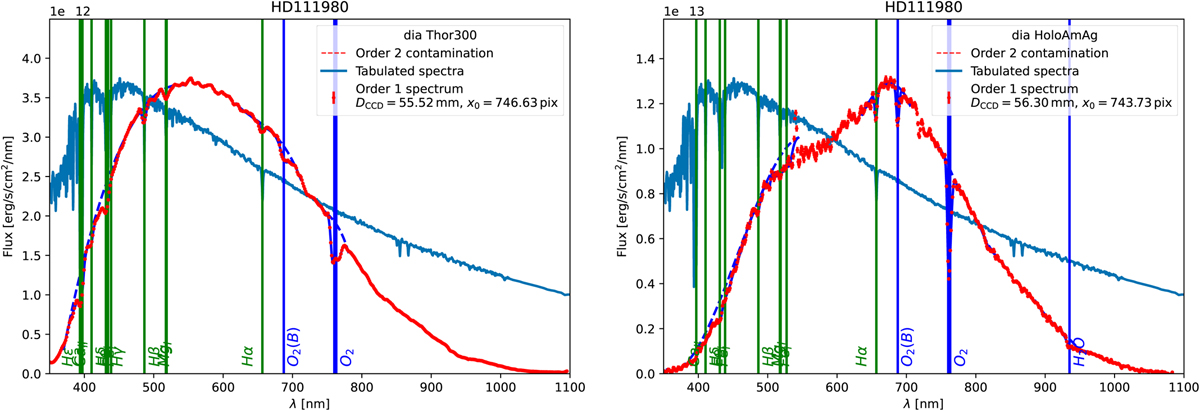
Calibrated spectra of CALSPEC star HD111980 observed at CTIO on 2017 May 30 with a blazed Thorlabs grating 300 lines mm−1 (left) and an amplitude hologram of 350 lines mn−1 (right). The CALSPEC SEDs are given for comparison (scaled for convenience). The two dispersers do not have the same transmission curves, which explains the different shapes of the spectra. The vertical lines indicate emission or absorption lines that are detected, positioned at their tabulated values. Locally, the dashed blue lines show the fitted continuum, and the plain blue lines are the Gaussian profiles fitted on absorption lines.
Current usage metrics show cumulative count of Article Views (full-text article views including HTML views, PDF and ePub downloads, according to the available data) and Abstracts Views on Vision4Press platform.
Data correspond to usage on the plateform after 2015. The current usage metrics is available 48-96 hours after online publication and is updated daily on week days.
Initial download of the metrics may take a while.