Fig. 23
Download original image
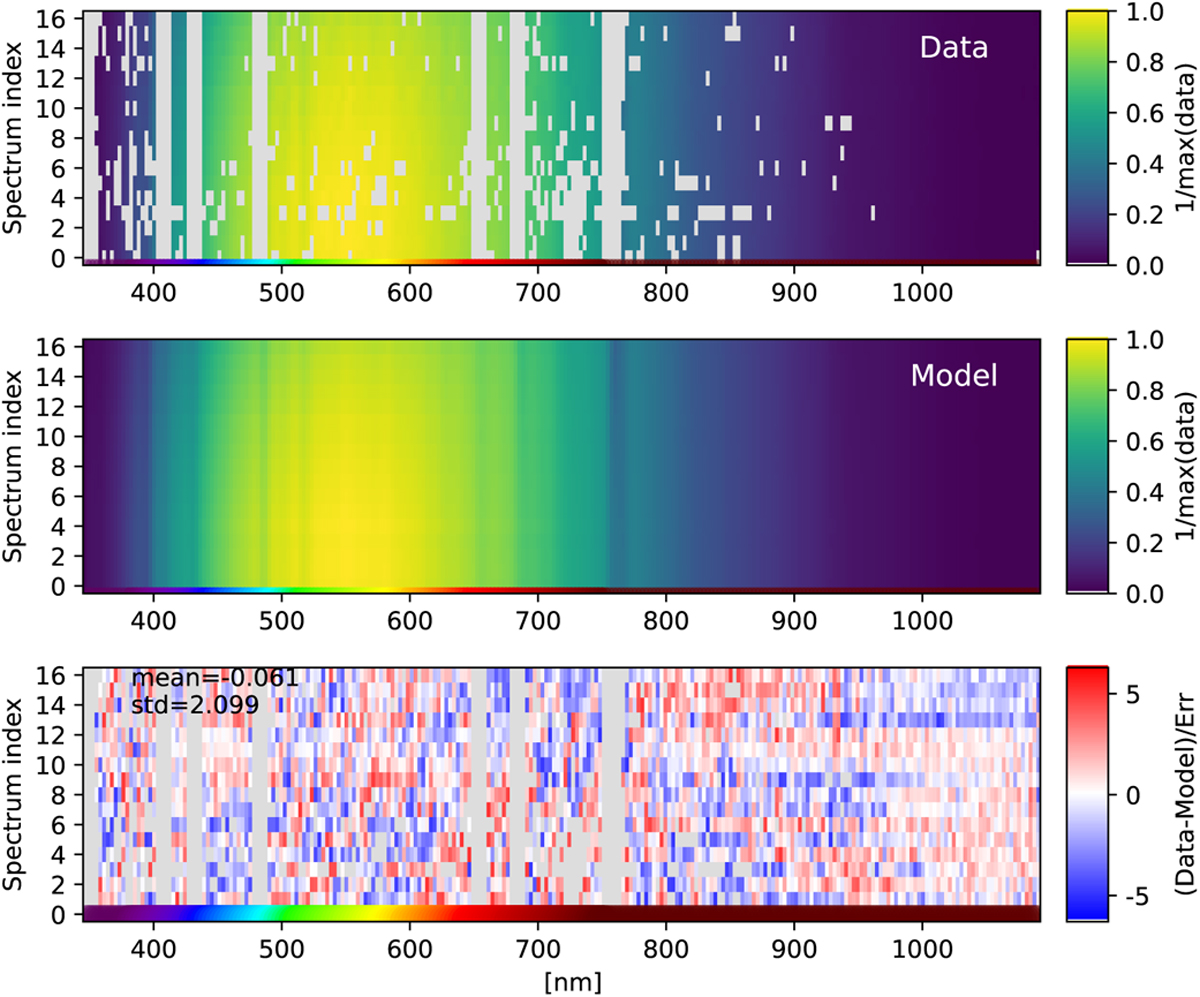
Multispectra fit of a CTIO photometric night using the blazed grating with 300 lines mm−1. Top: Dn data spectra binned in 3 nm intervals, indexed vertically by their index n and with a coloured amplitude. Masked regions are shown in grey. Middle: best-fitting spectrum models ![]() indexed vertically by their index n. Bottom: residual map.
indexed vertically by their index n. Bottom: residual map.
Current usage metrics show cumulative count of Article Views (full-text article views including HTML views, PDF and ePub downloads, according to the available data) and Abstracts Views on Vision4Press platform.
Data correspond to usage on the plateform after 2015. The current usage metrics is available 48-96 hours after online publication and is updated daily on week days.
Initial download of the metrics may take a while.