Open Access
Fig. 3
Download original image
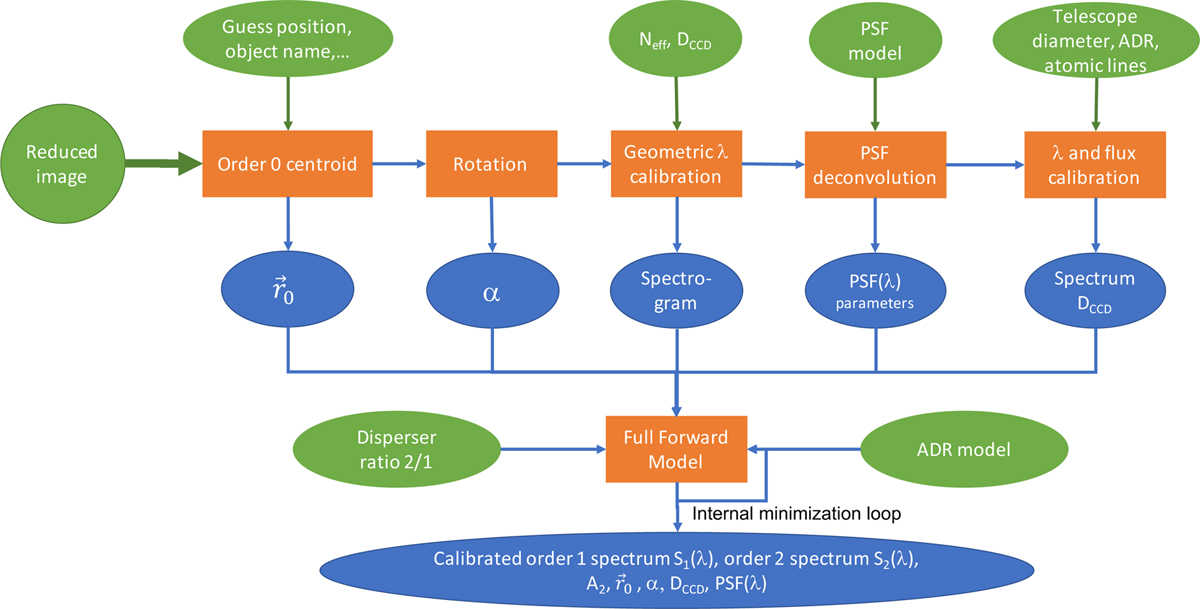
Overview of the Spectractor pipeline. The green ellipses represent external inputs needed for the spectrum extraction, and blue ellipses stand for the Spectractor products. The bottom stage represents the full forward-modelling method for extracting the spectrum from the raw spectrogram.
Current usage metrics show cumulative count of Article Views (full-text article views including HTML views, PDF and ePub downloads, according to the available data) and Abstracts Views on Vision4Press platform.
Data correspond to usage on the plateform after 2015. The current usage metrics is available 48-96 hours after online publication and is updated daily on week days.
Initial download of the metrics may take a while.