Open Access
Fig. 30
Download original image
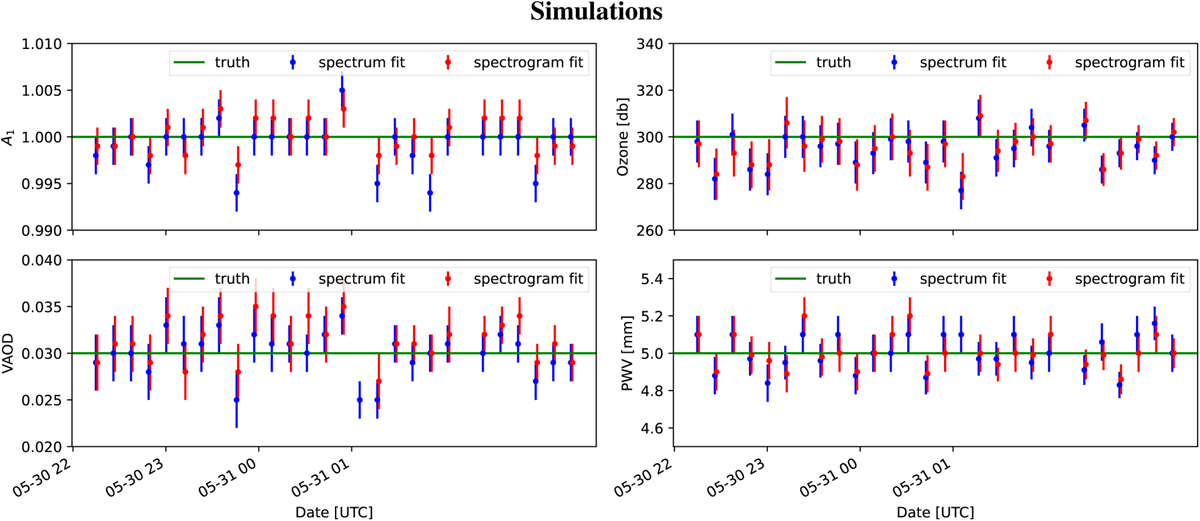
Evolution of the atmospheric parameters in the simulation of the night of 2017 May 30, in which CALSPEC star HD111980 was observed with an amplitude hologram. The blue points show the spectrum fits, while the orange points show the spectrogram fits. The green line gives the true values injected in the simulations.
Current usage metrics show cumulative count of Article Views (full-text article views including HTML views, PDF and ePub downloads, according to the available data) and Abstracts Views on Vision4Press platform.
Data correspond to usage on the plateform after 2015. The current usage metrics is available 48-96 hours after online publication and is updated daily on week days.
Initial download of the metrics may take a while.