Fig. 15
Download original image
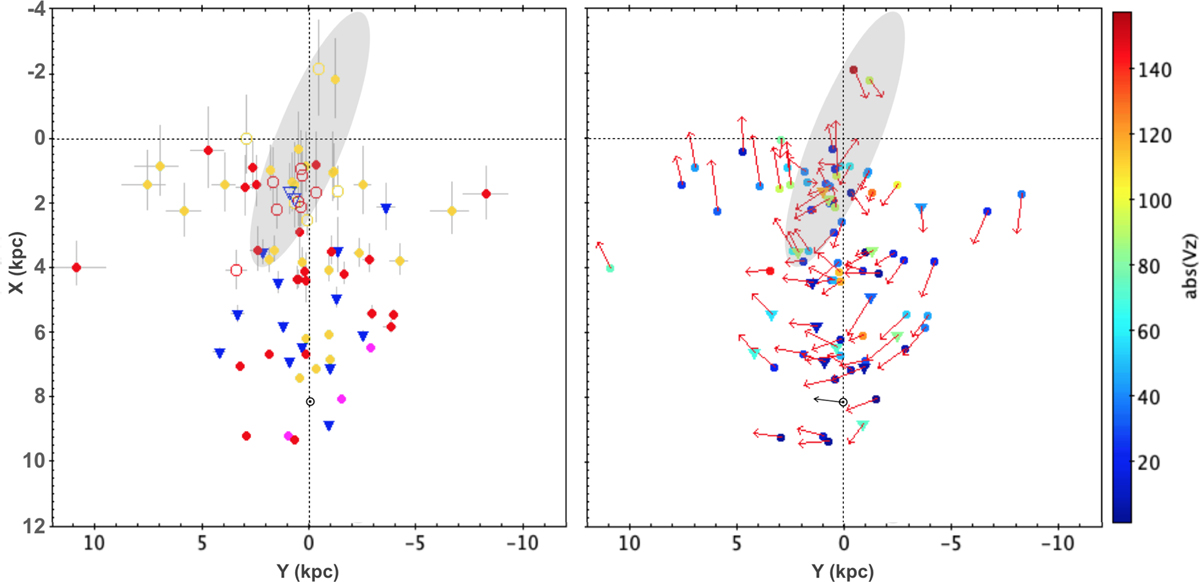
Rectangular Galactocentric X versus Y distribution of our selected targets. The grey area represents the approximate position and shape of the Galactic bulge. The Sun is indicated at (X,Y)=(8.2, 0) kpc. Left: selected targets with peculiar velocities higher than 200 km s−1 relative to LSR are represented with open symbols, while the others are represented with filled symbols. Right: red arrows represent the tangential velocities, ![]() , of the targets, which are colour-coded for their absolute velocities perpendicular to the plane, Vɀ. The colour code is identical to that of Fig. 16 with large dots and circles representing HdC stars and down triangles representing the EHe stars.
, of the targets, which are colour-coded for their absolute velocities perpendicular to the plane, Vɀ. The colour code is identical to that of Fig. 16 with large dots and circles representing HdC stars and down triangles representing the EHe stars.
Current usage metrics show cumulative count of Article Views (full-text article views including HTML views, PDF and ePub downloads, according to the available data) and Abstracts Views on Vision4Press platform.
Data correspond to usage on the plateform after 2015. The current usage metrics is available 48-96 hours after online publication and is updated daily on week days.
Initial download of the metrics may take a while.