Fig. 3
Download original image
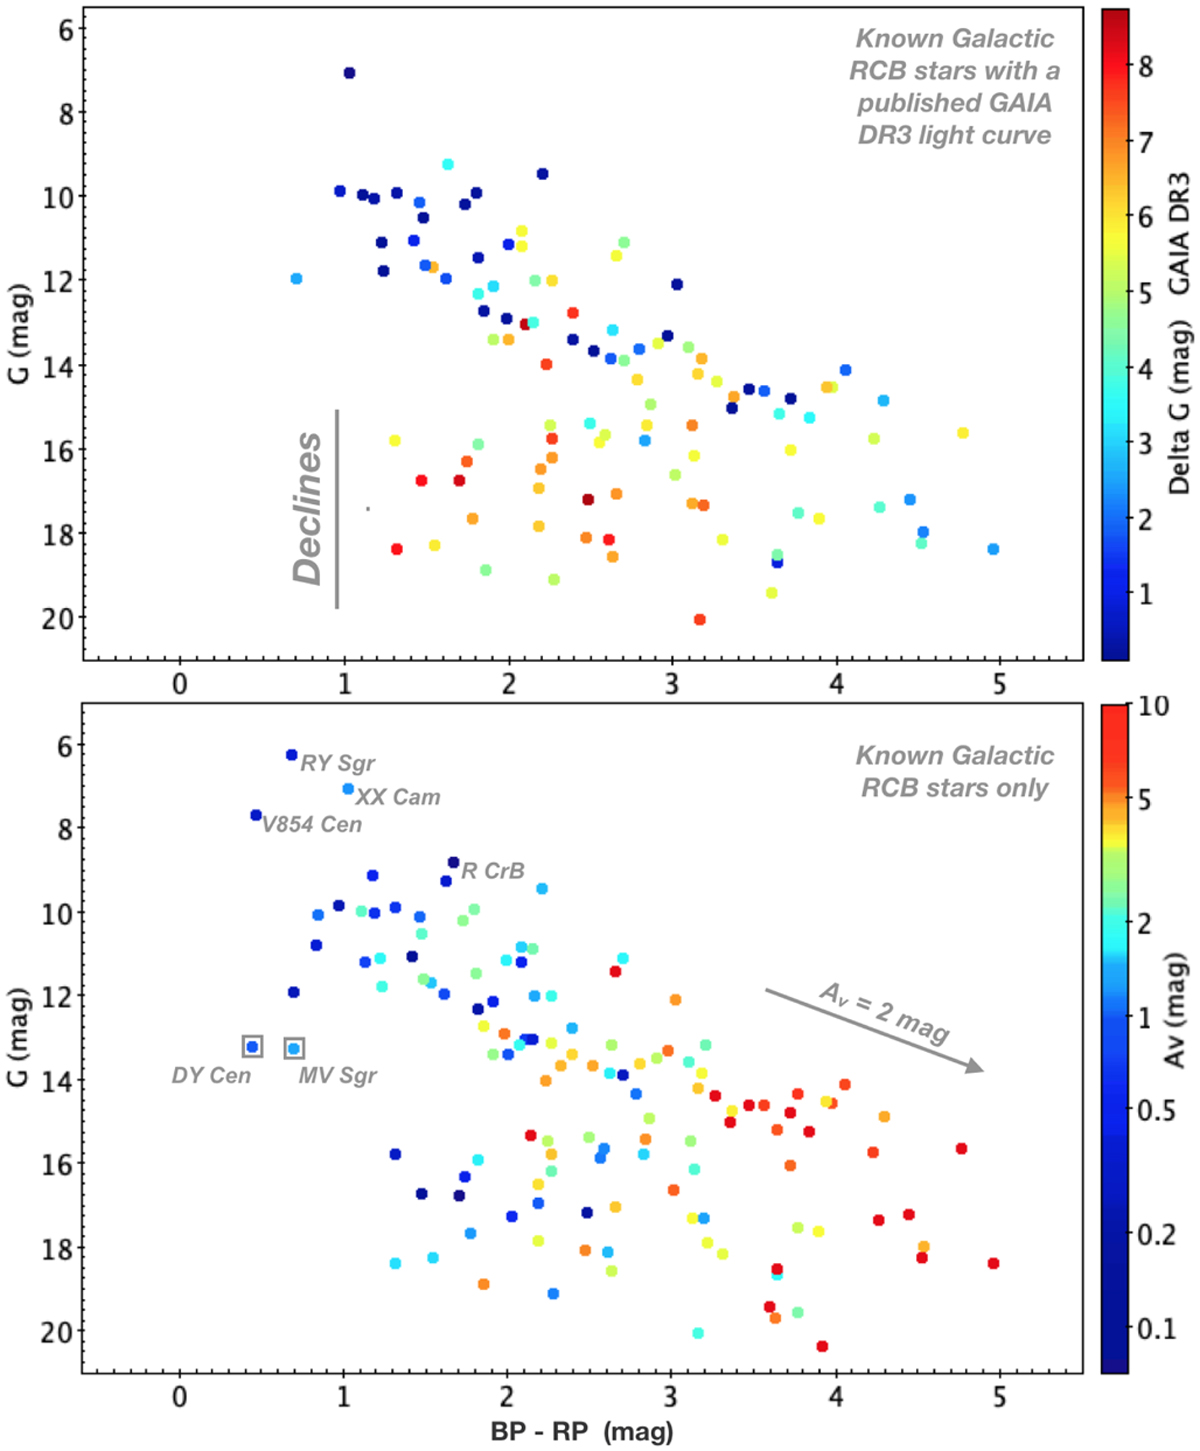
Colour magnitude diagram G vs. (BP-RP) with known RCB stars. Top: Diagram colour-coded by the maximum G-band variation observed in their respective Gaia light curve. The luminosity region containing RCB stars that went under a long decline events is indicated. Bottom: Diagram colour-coded by the visual interstellar extinction Av that was limited at a value of 10 mag. The arrow indicates the reddening effect of a 2 mag extinction.
Current usage metrics show cumulative count of Article Views (full-text article views including HTML views, PDF and ePub downloads, according to the available data) and Abstracts Views on Vision4Press platform.
Data correspond to usage on the plateform after 2015. The current usage metrics is available 48-96 hours after online publication and is updated daily on week days.
Initial download of the metrics may take a while.