Open Access
Fig. 4
Download original image
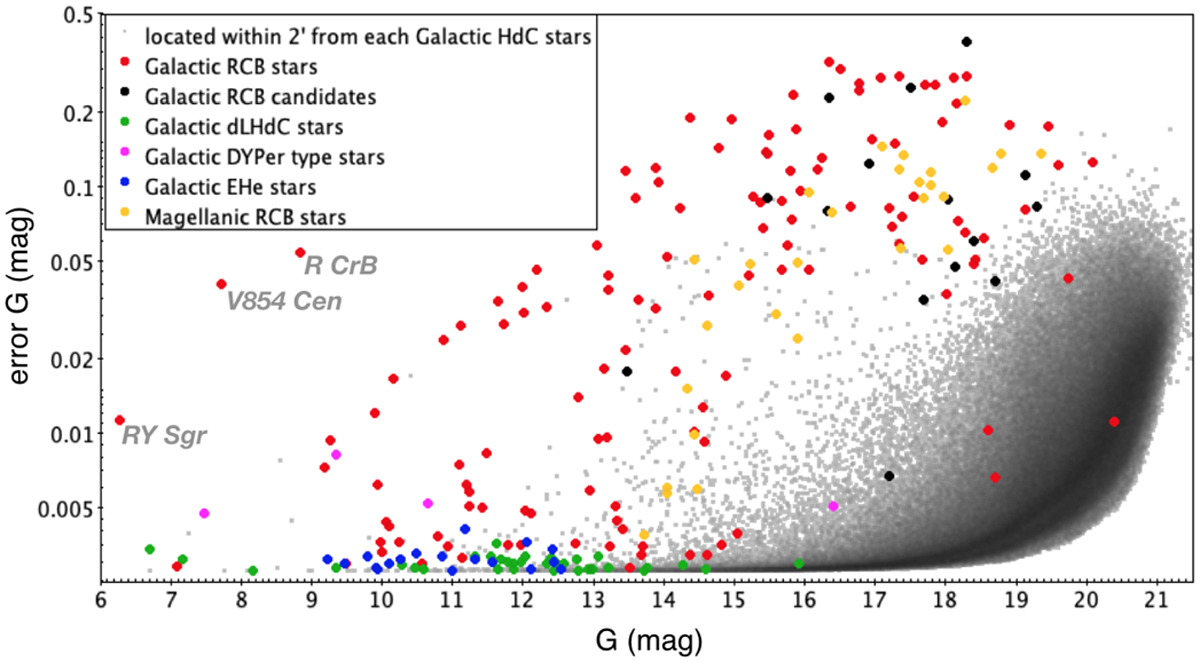
Diagram representing the standard error (log scale) versus the mean G-band magnitude for all our Galactic and Magellanic targets (large coloured dots) and for stars located within 2 arcmins of any known Galactic HdC stars (small grey dots). The names of three of the brightest RCB stars are indicated.
Current usage metrics show cumulative count of Article Views (full-text article views including HTML views, PDF and ePub downloads, according to the available data) and Abstracts Views on Vision4Press platform.
Data correspond to usage on the plateform after 2015. The current usage metrics is available 48-96 hours after online publication and is updated daily on week days.
Initial download of the metrics may take a while.