Fig. 7
Download original image
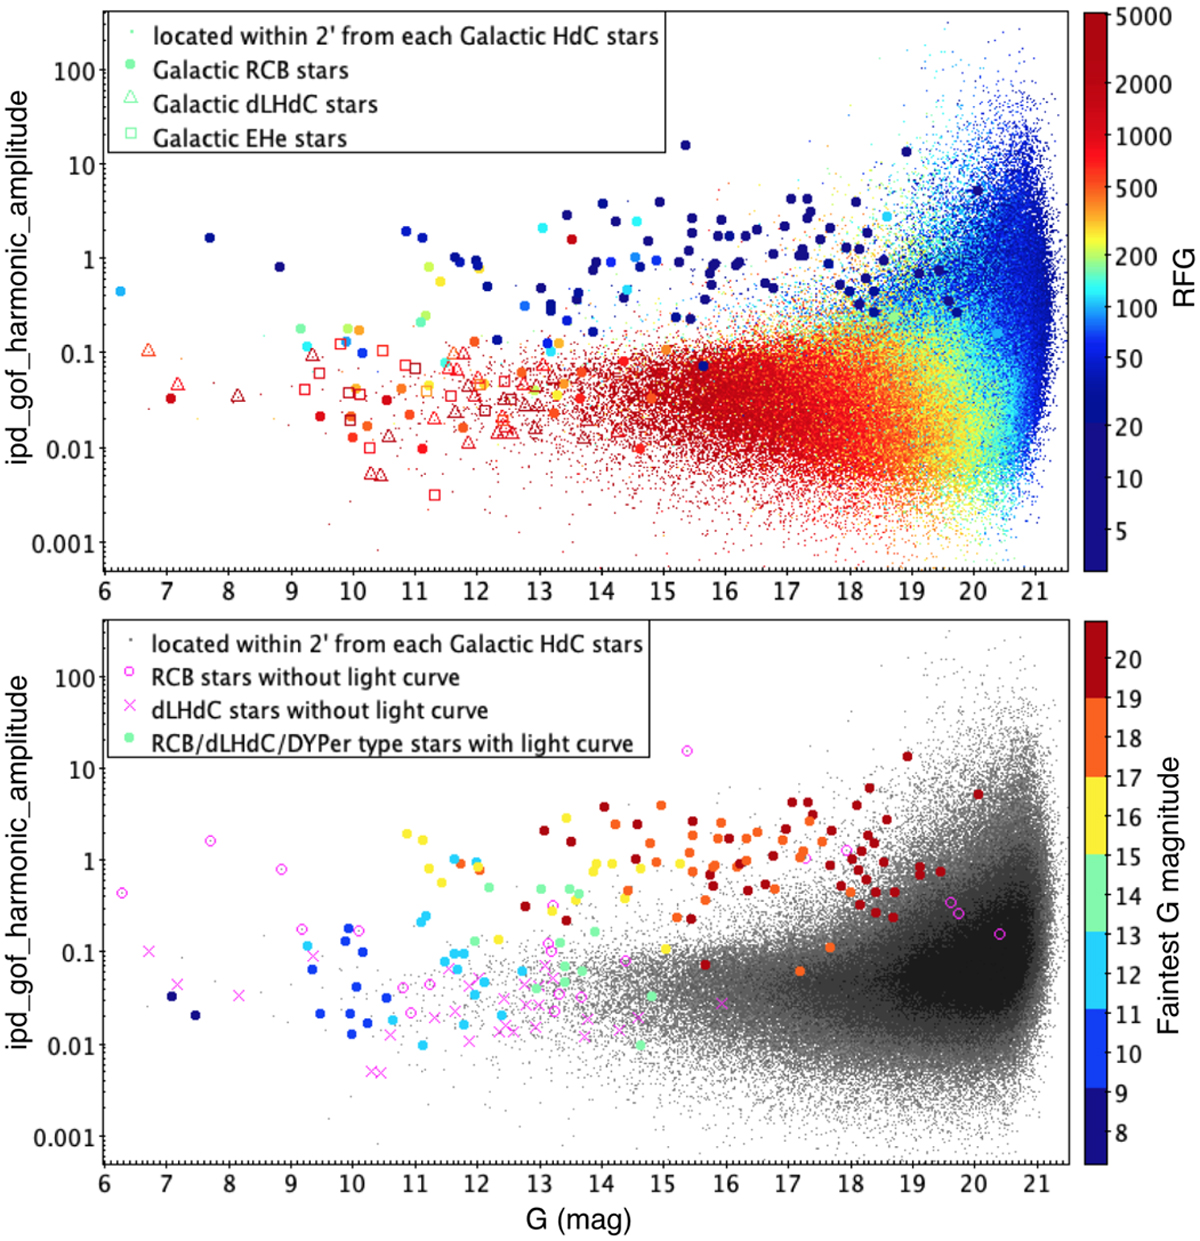
IPD parameter IPDgofha versus the mean G-band magnitude for our Galactic targets (large colour dots and circles) and stars located within 2 arcmins from them. Top: diagram colour-coded by the ratio G mean flux to its standard error (RFG). Bottom: our targets of interest are colour-coded by their faintest G-band magnitude as observed in their respective light curves. The targets with and without a published Gaia DR3 light curve are also indicated.
Current usage metrics show cumulative count of Article Views (full-text article views including HTML views, PDF and ePub downloads, according to the available data) and Abstracts Views on Vision4Press platform.
Data correspond to usage on the plateform after 2015. The current usage metrics is available 48-96 hours after online publication and is updated daily on week days.
Initial download of the metrics may take a while.