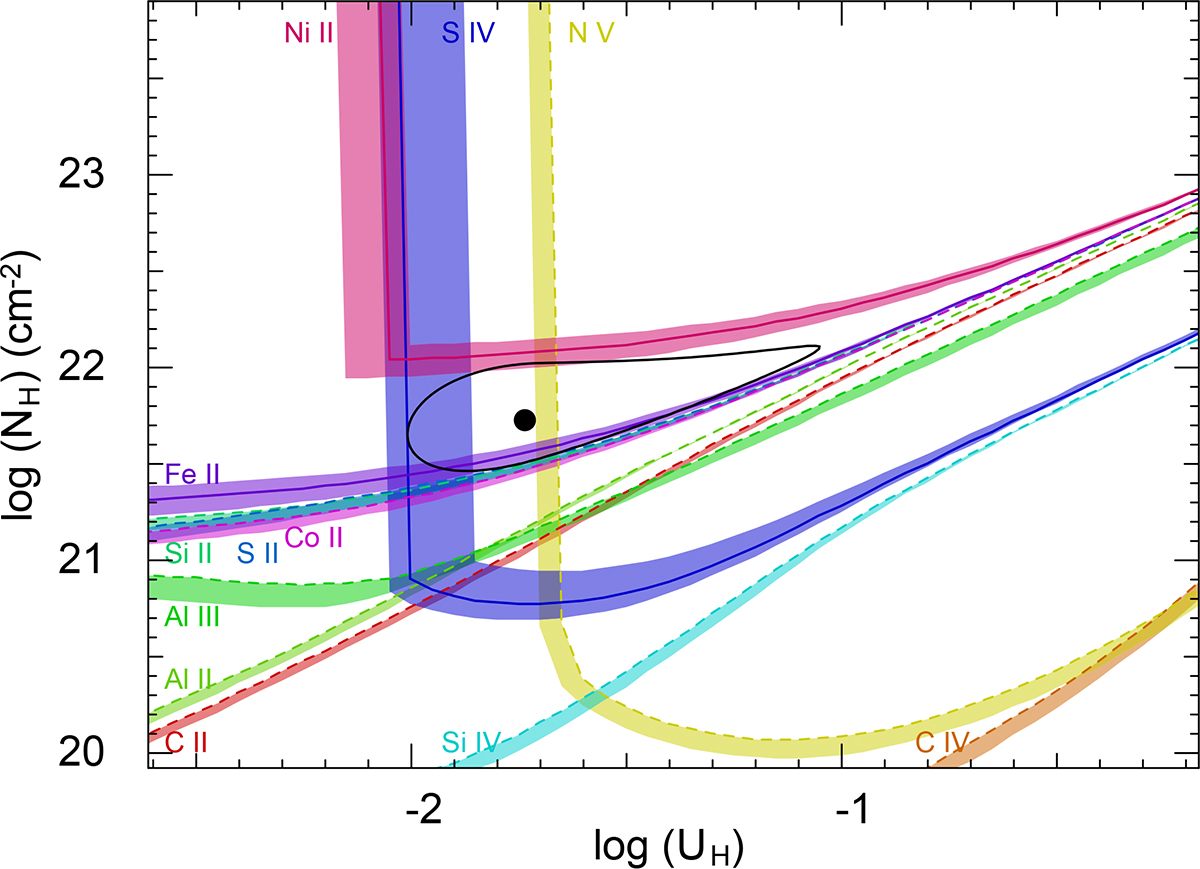
Fig. 4.
Download original image
Plot of hydrogen column density (log NH) vs. ionization parameter (log UH), with constraints based on the measured ionic column densities shown in Table 2. Measurements are shown as solid curves, while the dashed curves show lower limits. The colored shades indicate the uncertainties in the constraints of the parameters based on the uncertainties in column density. The black dot shows the solution of log NH and log UH that best matches the column densities, while the black ellipse indicates the 1-σ error.
Current usage metrics show cumulative count of Article Views (full-text article views including HTML views, PDF and ePub downloads, according to the available data) and Abstracts Views on Vision4Press platform.
Data correspond to usage on the plateform after 2015. The current usage metrics is available 48-96 hours after online publication and is updated daily on week days.
Initial download of the metrics may take a while.