Open Access
Fig. 2.
Download original image
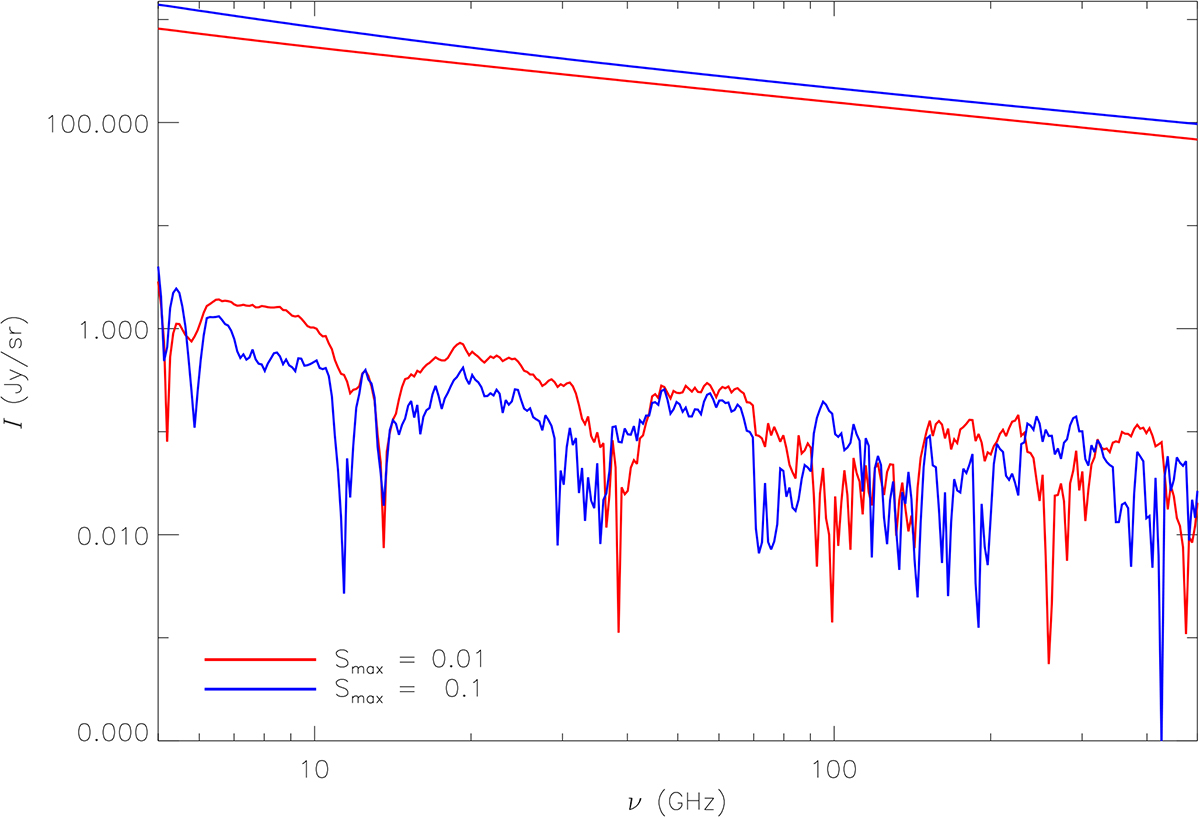
Absolute value of the difference between the log–log polynomial interpolations and the original tabulations (bottom curves) for the maximum and minimum detection thresholds adopted in the calculation of the ESMB total intensity (top curves). See legend for an explanation of the symbols and lines.
Current usage metrics show cumulative count of Article Views (full-text article views including HTML views, PDF and ePub downloads, according to the available data) and Abstracts Views on Vision4Press platform.
Data correspond to usage on the plateform after 2015. The current usage metrics is available 48-96 hours after online publication and is updated daily on week days.
Initial download of the metrics may take a while.