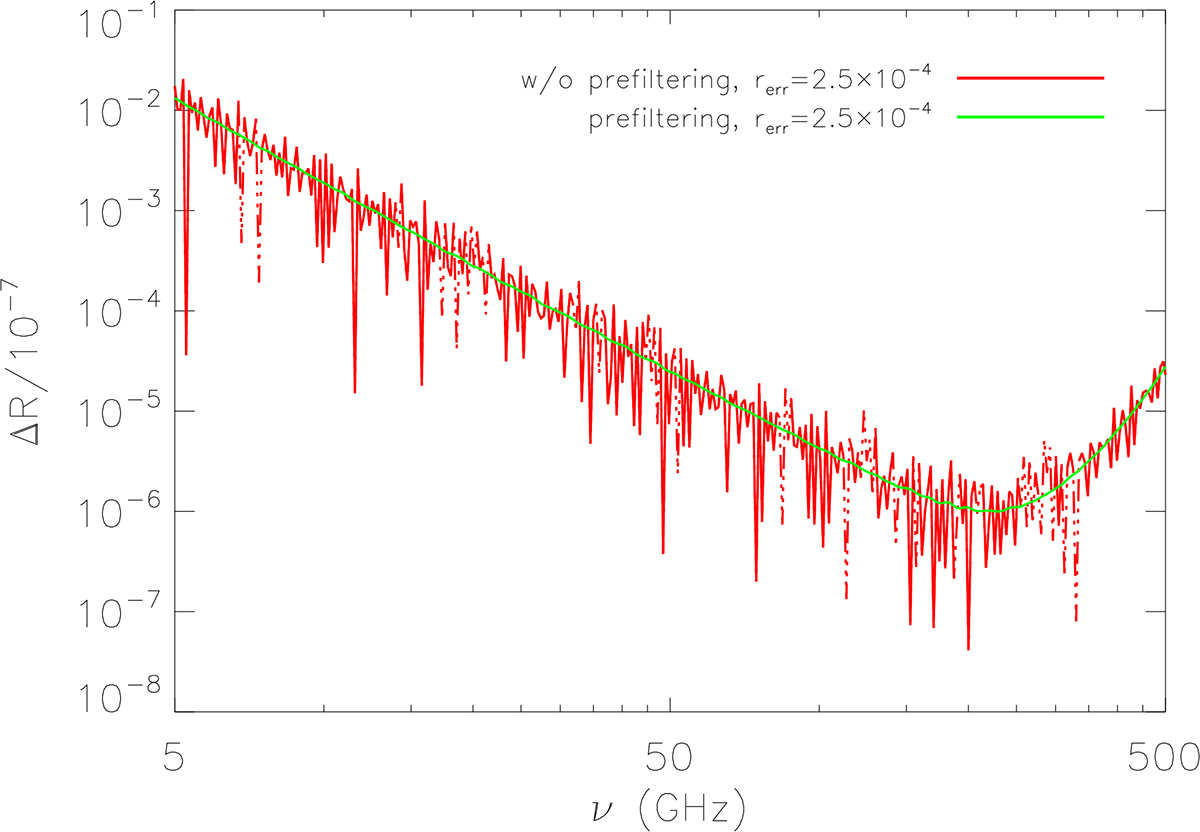
Fig. 7.
Download original image
ΔR evaluated assuming the analytical representation of the ESMB with a detection threshold of Smax = 0.1 Jy, considering a relative error and including or not including the prefiltering. The curve corresponding to the ideal case is almost superimposed on the green curve, and therefore it is not reported for simplicity. Here (and in the following analogous figures), solid (dots) lines refer to positive (negative) values. See legend for an explanation of the symbols and lines.
Current usage metrics show cumulative count of Article Views (full-text article views including HTML views, PDF and ePub downloads, according to the available data) and Abstracts Views on Vision4Press platform.
Data correspond to usage on the plateform after 2015. The current usage metrics is available 48-96 hours after online publication and is updated daily on week days.
Initial download of the metrics may take a while.