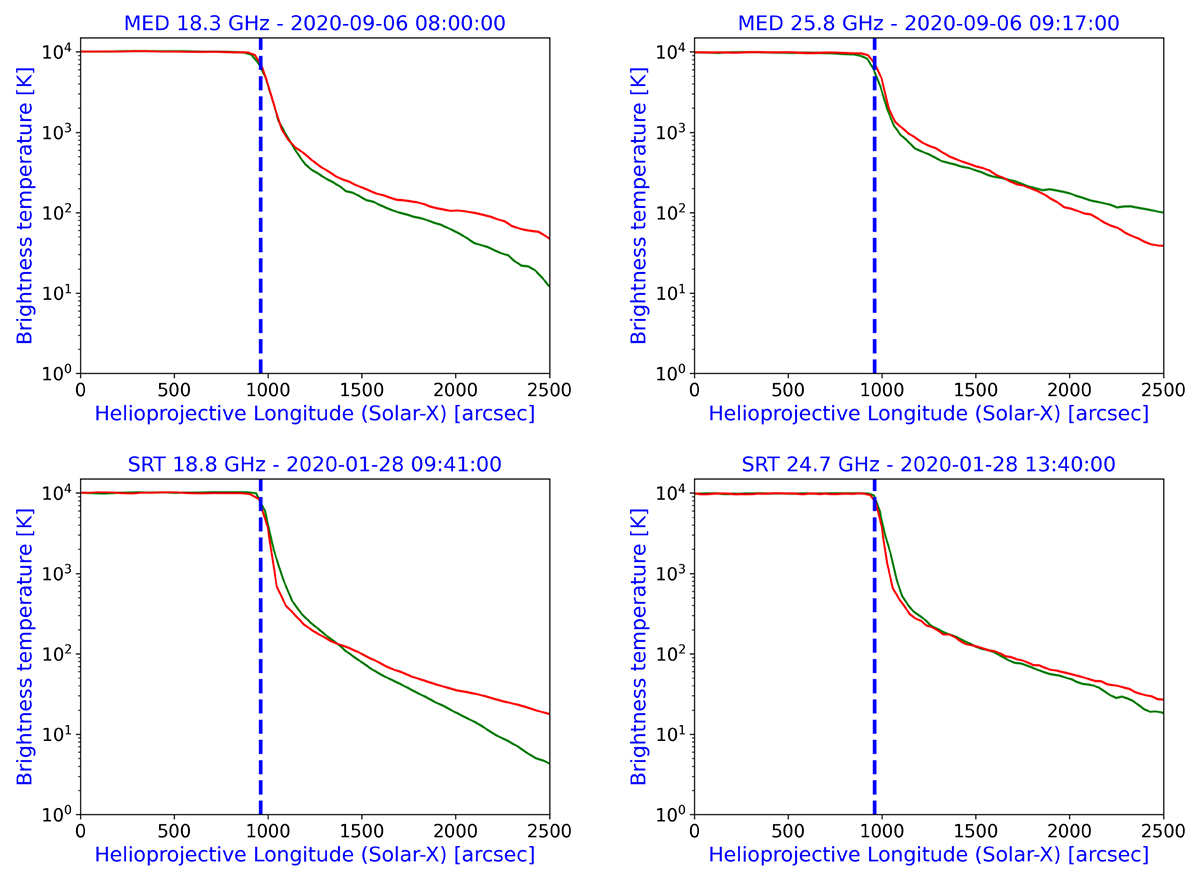
Fig. 1.
Download original image
Examples of polar (red line) and equatorial (green line) brightness temperature profiles derived from solar images obtained through the Grueff Radio Telescope and SRT. Top: profiles derived on September 6, 2020 from the 18.3 GHz (left) and 25.8 GHz (right) Grueff Radio Telescope images. Bottom: profiles derived on January 28, 2020 from the 18.8 GHz (left) and 24.7 GHz (right) SRT images. Typical errors in the brightness profiles are in the 5–20 K range, significantly affecting only the outwards tails. Blue dashed lines indicate the solar radius at the photosphere level R⊙,opt = 959.16 ± 0.19 arcsec (Mamajek et al. 2015; Prša et al. 2016; Haberreiter et al. 2008).
Current usage metrics show cumulative count of Article Views (full-text article views including HTML views, PDF and ePub downloads, according to the available data) and Abstracts Views on Vision4Press platform.
Data correspond to usage on the plateform after 2015. The current usage metrics is available 48-96 hours after online publication and is updated daily on week days.
Initial download of the metrics may take a while.