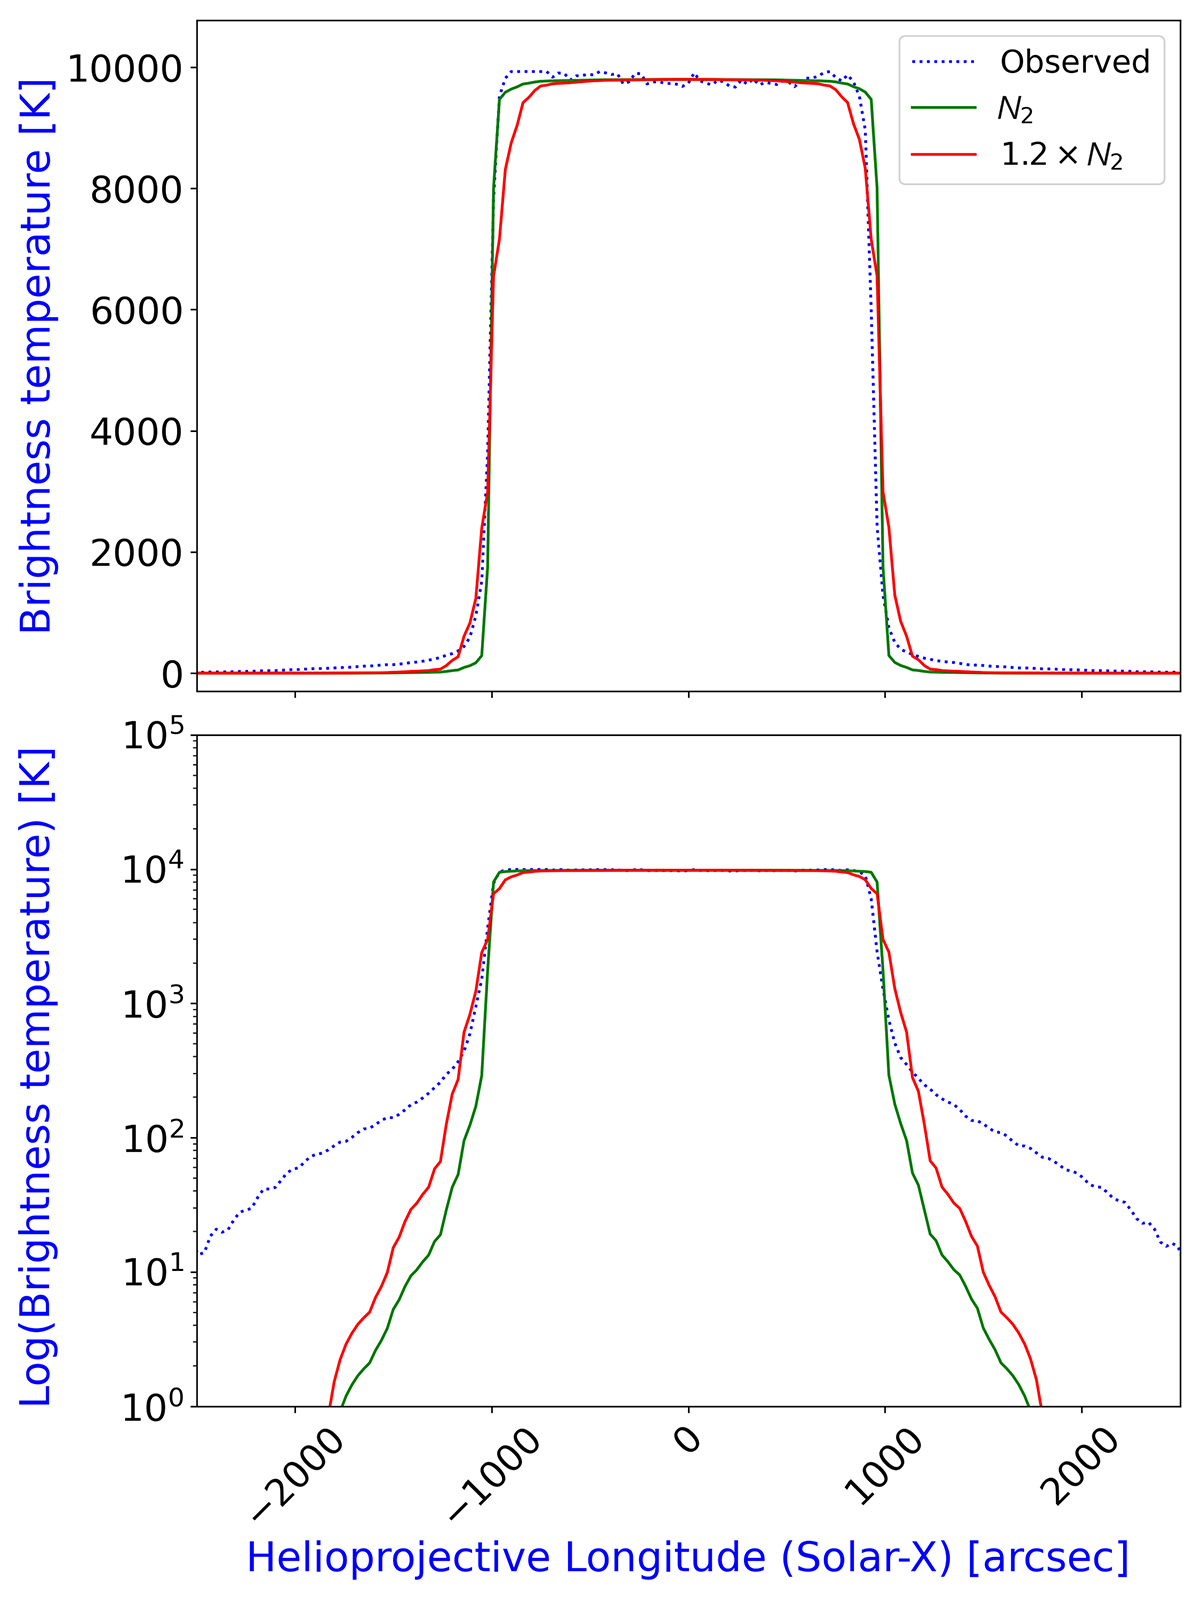
Fig. 2.
Download original image
Example of modelled equatorial TB profiles of a solar map obtained adopting the ECB-model as the solar signal for SRT at 24.7 GHz (October 9, 2019), in comparison with the observed brightness profile. These plots differ in the TBy-axis scale (linear on top, logarithmic on bottom). Blue dotted line indicates the observed equatorial TB profile of a solar map at this observing frequency with SRT, green solid line indicates the equatorial TB profile obtained convolving the solar signal model with the GRASP original beam pattern, and red solid line indicates the modelled equatorial TB profile obtained with a generic beam pattern with the secondary lobe characterised by A2 = 1.2 × a2 (where a2 is the reference value obtained by GRASP).
Current usage metrics show cumulative count of Article Views (full-text article views including HTML views, PDF and ePub downloads, according to the available data) and Abstracts Views on Vision4Press platform.
Data correspond to usage on the plateform after 2015. The current usage metrics is available 48-96 hours after online publication and is updated daily on week days.
Initial download of the metrics may take a while.