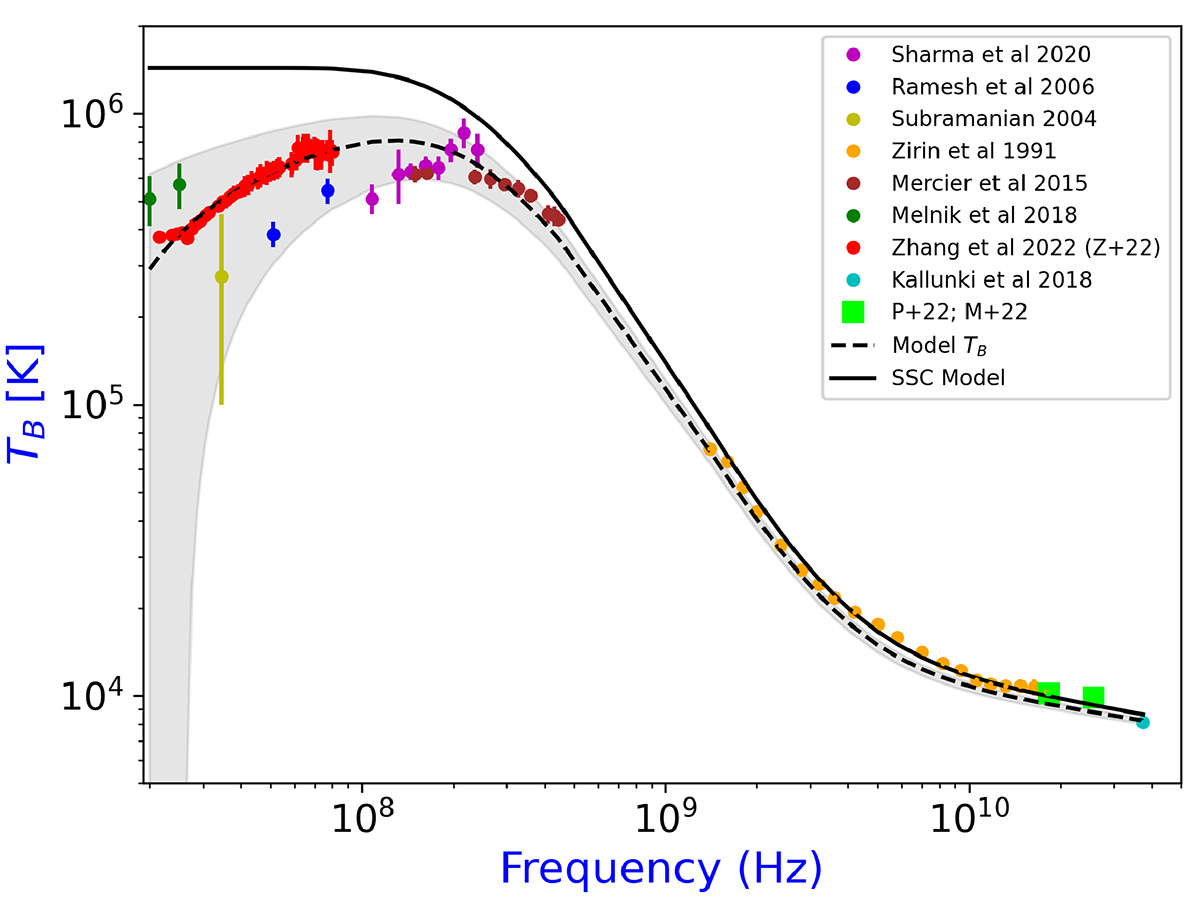
Fig. 4.
Download original image
Brightness temperature spectrum TB(ν) for the solar disk centre obtained from the data of the INAF radio telescopes (averaged values TB, av from Medicina, Table 5), and of previous works: Zirin et al. (1991), Subramanian (2004), Ramesh et al. (2006), Mercier & Chambe (2015), Melnik et al. (2018), Kallunki & Tornikoski (2018), Sharma & Oberoi (2020), Zhang et al. (2022). The black continuous line represents the modelled brightness temperature of bremsstrahlung emission obtained by the SSC model (Selhorst et al. 2005, 2019; Zhang et al. 2022); the black dashed line represents the fitted flux accounting for propagation effects; the dark grey shaded area shows the errors in the fit parameters. Green points indicate the measurements obtained from the averaged solar maps of the Grueff Radio Telescope (TB, av in Table 5), according to the analysis of Pellizzoni et al. (2022) (P+22) and Mulas et al. (2022) (M+22). This figure is an updated version of the figure reported by Zhang et al. (2022).
Current usage metrics show cumulative count of Article Views (full-text article views including HTML views, PDF and ePub downloads, according to the available data) and Abstracts Views on Vision4Press platform.
Data correspond to usage on the plateform after 2015. The current usage metrics is available 48-96 hours after online publication and is updated daily on week days.
Initial download of the metrics may take a while.