Fig. 7.
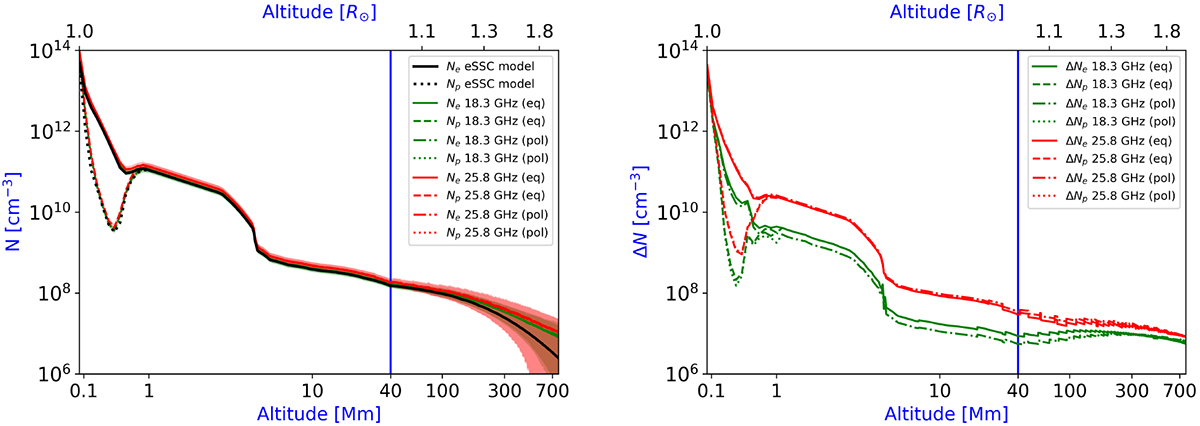
Download original image
Distribution of N (electrons Ne and protons Np, left) and ΔN (right) as a function of the altitude from the solar surface, defined as the photosphere level R⊙,opt. The respective shaded area indicates the 1σ error of these distributions. The black line indicates the theoretical N distributions of the original eSSC model. The blue vertical line indicates the altitude, hSSC, below which the SSC model is defined. The y-axis of these plots is shown in logarithmic scale. The best-fit n distributions are compatible (within an uncertainty ≲25%) with the original eSSC model below ∼100 Mm; above this altitude, these distributions are characterised by high uncertainty (up to 70%).
Current usage metrics show cumulative count of Article Views (full-text article views including HTML views, PDF and ePub downloads, according to the available data) and Abstracts Views on Vision4Press platform.
Data correspond to usage on the plateform after 2015. The current usage metrics is available 48-96 hours after online publication and is updated daily on week days.
Initial download of the metrics may take a while.