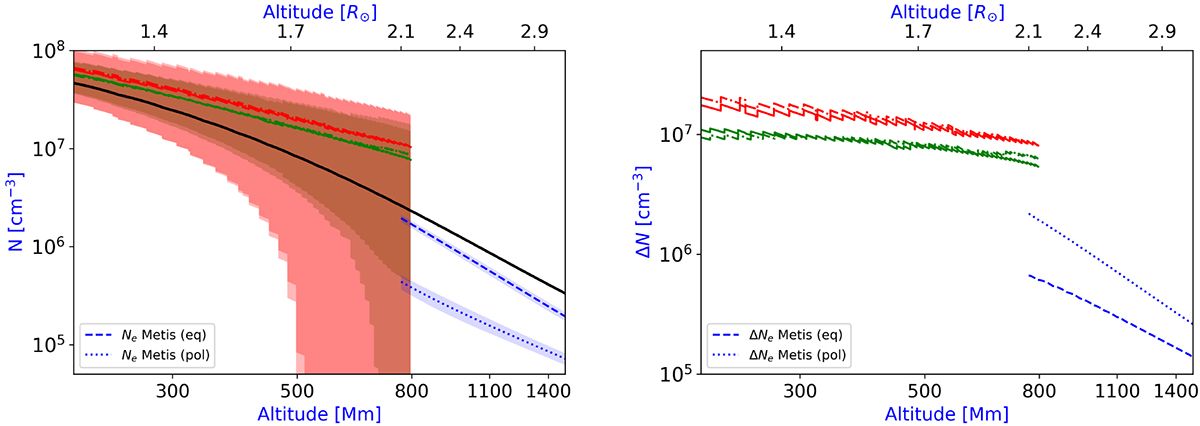
Fig. 8.
Download original image
Distribution of N (left) and ΔN (right) as a function of the altitude from the solar surface. Green and red lines indicate the measured Ne obtained through observations with Grueff at 18.3 GHz (green) and 25.8 GHz (red) during a period of minimum solar activity (2018–2020), respectively (see the legend of the right panel in Fig. 7). The shaded area indicates the 1σ error of the distributions. Blue lines indicate the measured Ne obtained through observations with Metis (dashed line: equatorial component; dotted line: polar component) during the ascending phase of the solar cycle (March 2022). The black line indicates the theoretical Ne associated with the original eSSC model. The y-axis of these plots is shown in logarithmic scale. In the right panel, the difference between ΔNe referred to Metis data is reported in terms of absolute value.
Current usage metrics show cumulative count of Article Views (full-text article views including HTML views, PDF and ePub downloads, according to the available data) and Abstracts Views on Vision4Press platform.
Data correspond to usage on the plateform after 2015. The current usage metrics is available 48-96 hours after online publication and is updated daily on week days.
Initial download of the metrics may take a while.