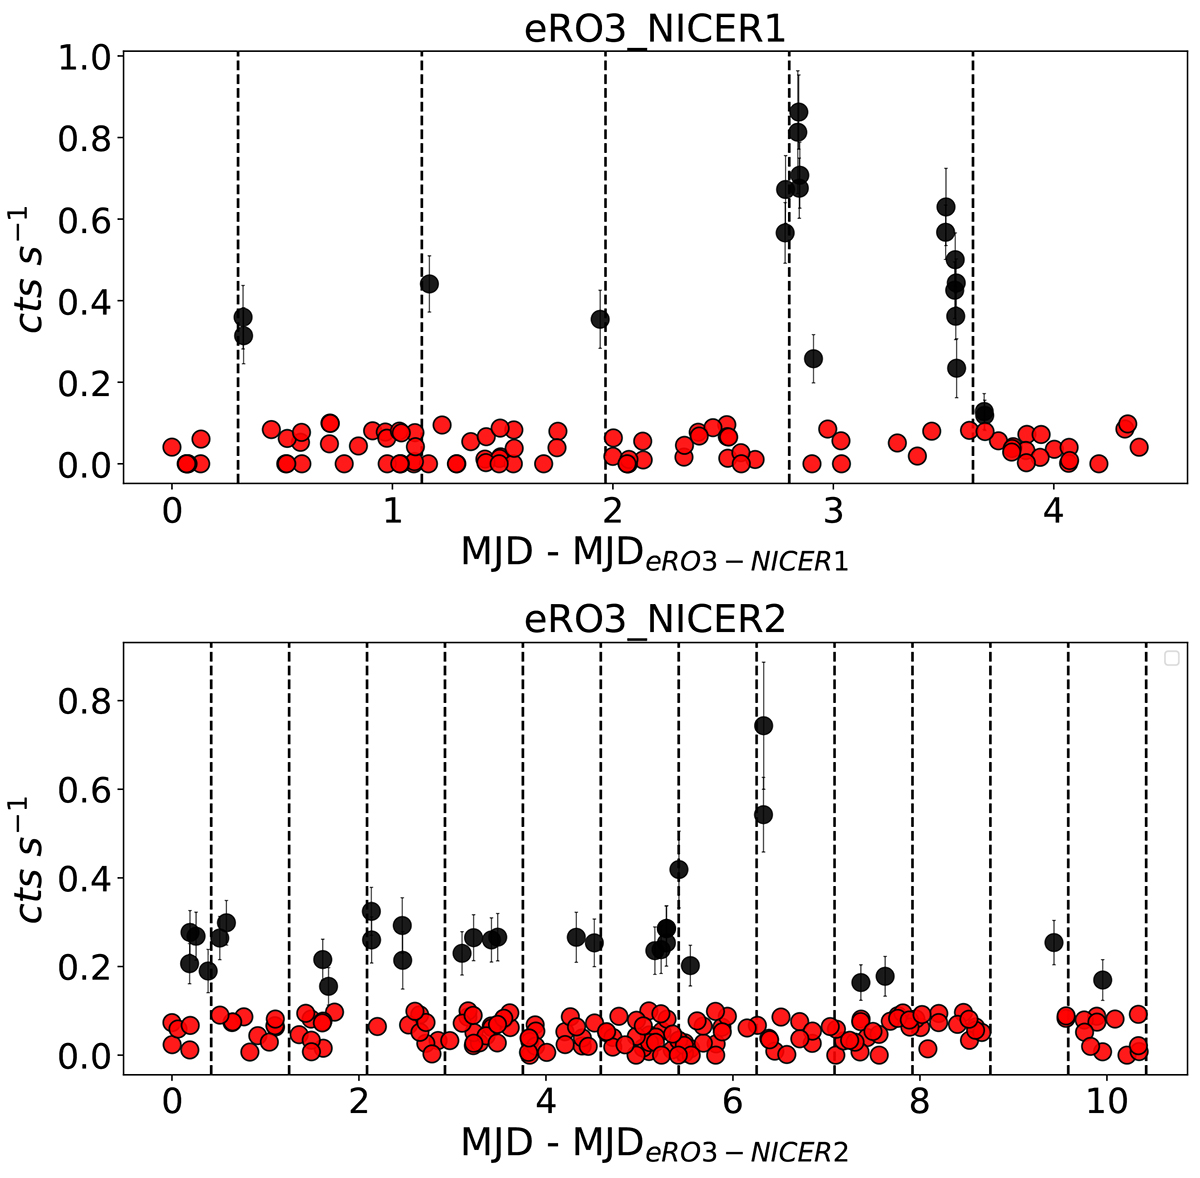
Fig. 8.
Download original image
NICER background-subtracted 0.2 − 2.0 keV light curve of eRO-QPE3, in the epoch eRO3-NICER1 (top, starting at MJD 59697.644) and eRO3-NICER2 (bottom, starting at MJD 59822.782). Black points represent secure detections of a source component on top of background emission, contrary to the epochs shown in red which are consistent with background-only. Vertical dashed lines represent evenly spaced recurrences of 20 h, as a guide for the eye.
Current usage metrics show cumulative count of Article Views (full-text article views including HTML views, PDF and ePub downloads, according to the available data) and Abstracts Views on Vision4Press platform.
Data correspond to usage on the plateform after 2015. The current usage metrics is available 48-96 hours after online publication and is updated daily on week days.
Initial download of the metrics may take a while.