Open Access
Fig. 12
Download original image
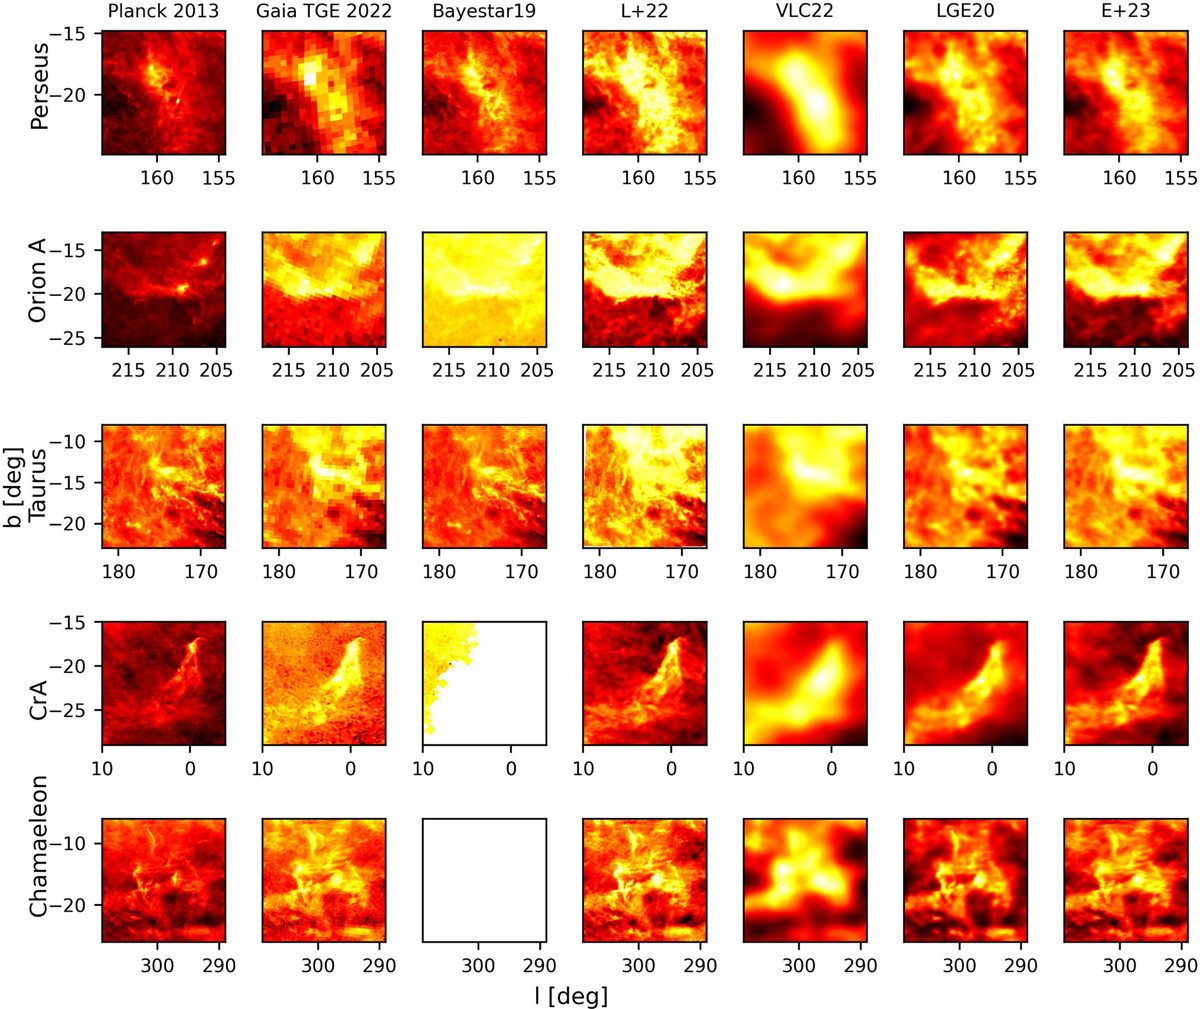
Zoomed-in views toward the individual molecular clouds (Perseus, Orion, Taurus, Corona Australis, and Chamaeleon) seen in Fig. 11. The colorbars are logarithmic and span the full dynamic range of the selected POS slice in every image. Each row is a separate region and each column a separate reconstruction.
Current usage metrics show cumulative count of Article Views (full-text article views including HTML views, PDF and ePub downloads, according to the available data) and Abstracts Views on Vision4Press platform.
Data correspond to usage on the plateform after 2015. The current usage metrics is available 48-96 hours after online publication and is updated daily on week days.
Initial download of the metrics may take a while.