Fig. A.1
Download original image
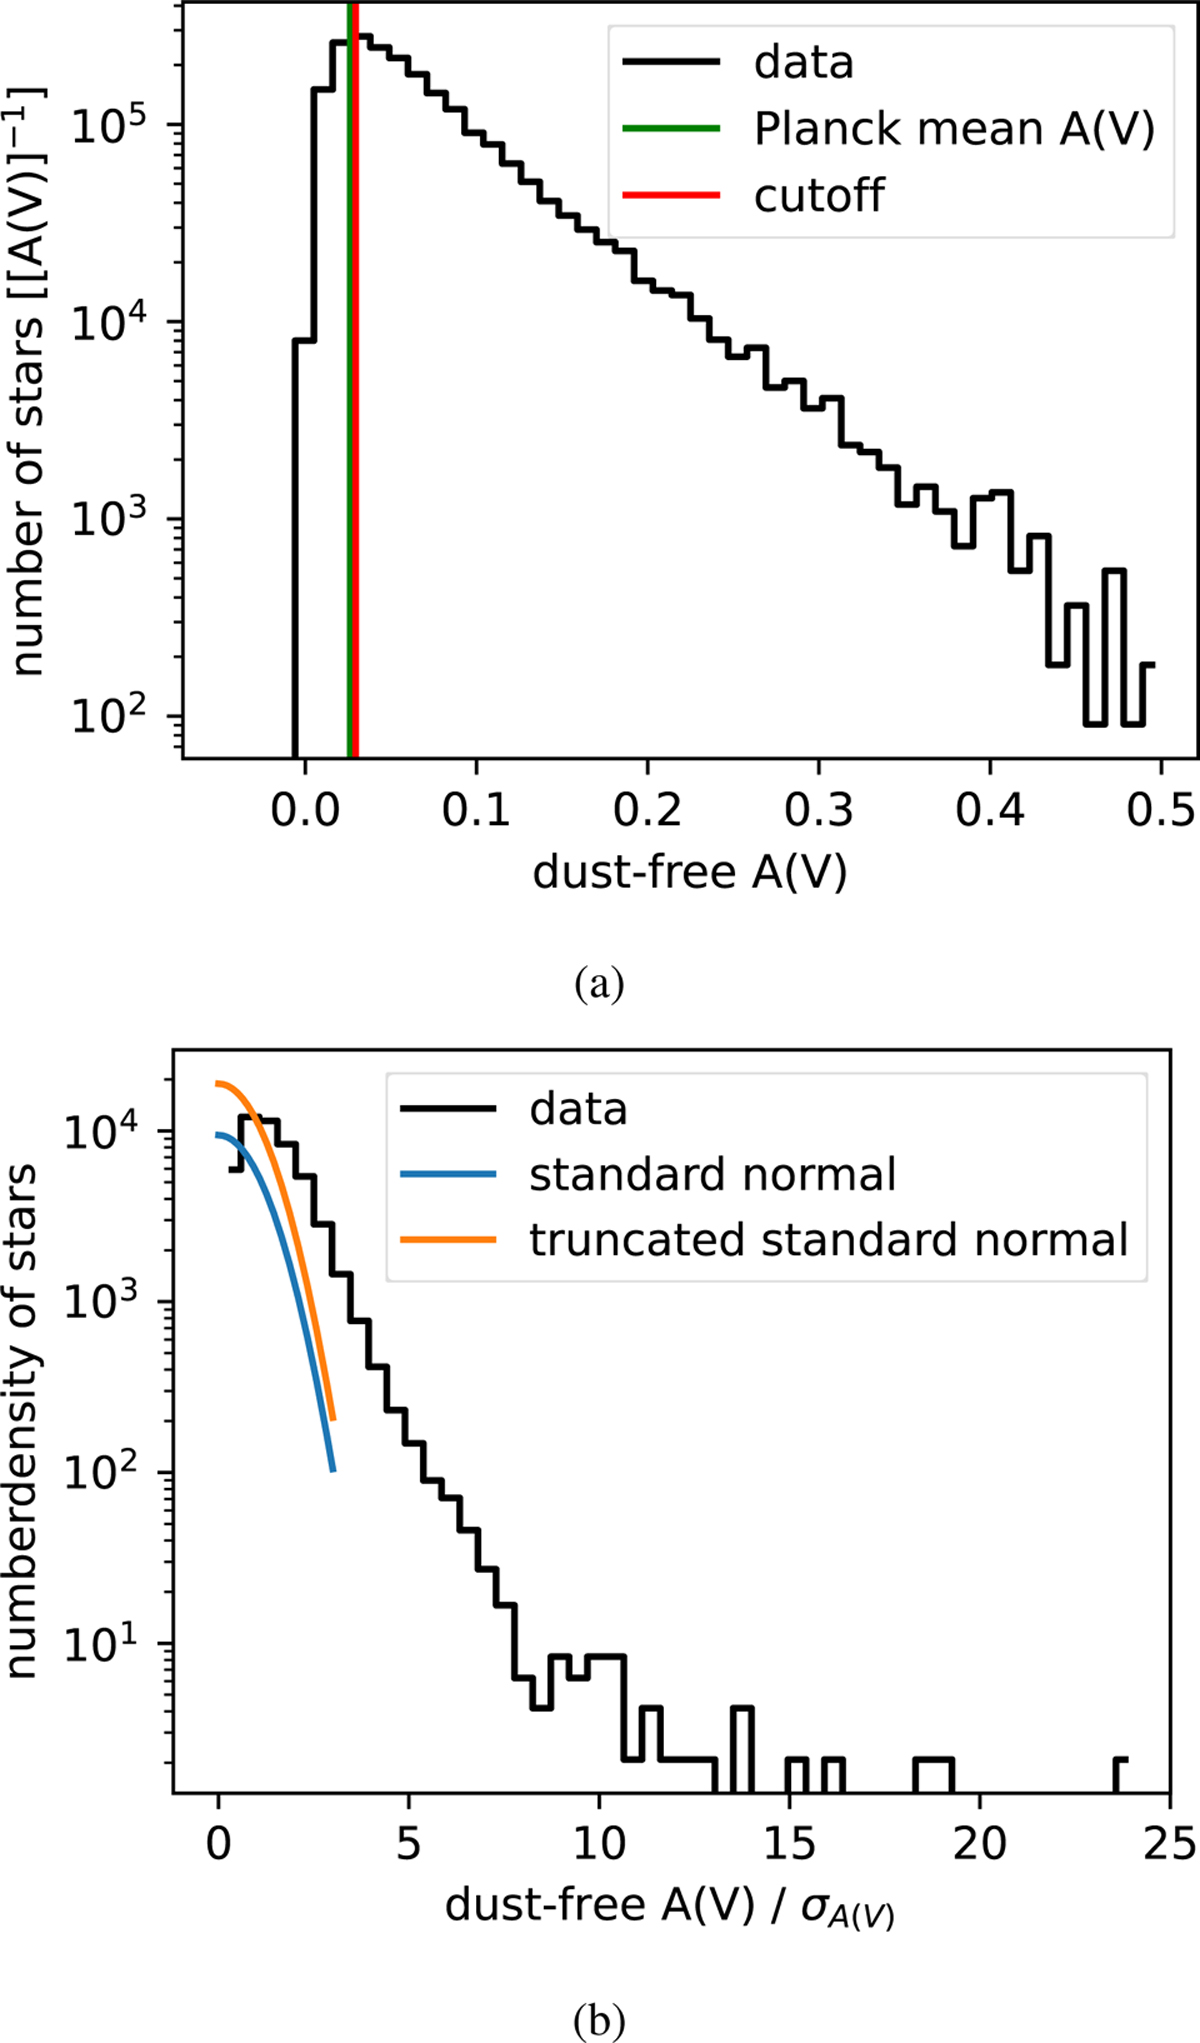
Absolute and relative ZGR23 extinction in dust-free regions. Panel (a): Histogram of the ZGR23 extinctions in dust-free regions translated to AV. The mean extinction in dust-free regions based on Planck is shown as a vertical green line, and the cutoff value translated to AV for our definition of dust-free is shown in red. Panel (b): Same as panel (a) but the extinctions are scaled by their accompanying uncertainties. A truncated standard normal distribution and a standard normal distribution are plotted on top. Both ordinates are logarithmic.
Current usage metrics show cumulative count of Article Views (full-text article views including HTML views, PDF and ePub downloads, according to the available data) and Abstracts Views on Vision4Press platform.
Data correspond to usage on the plateform after 2015. The current usage metrics is available 48-96 hours after online publication and is updated daily on week days.
Initial download of the metrics may take a while.