Fig. D.3
Download original image
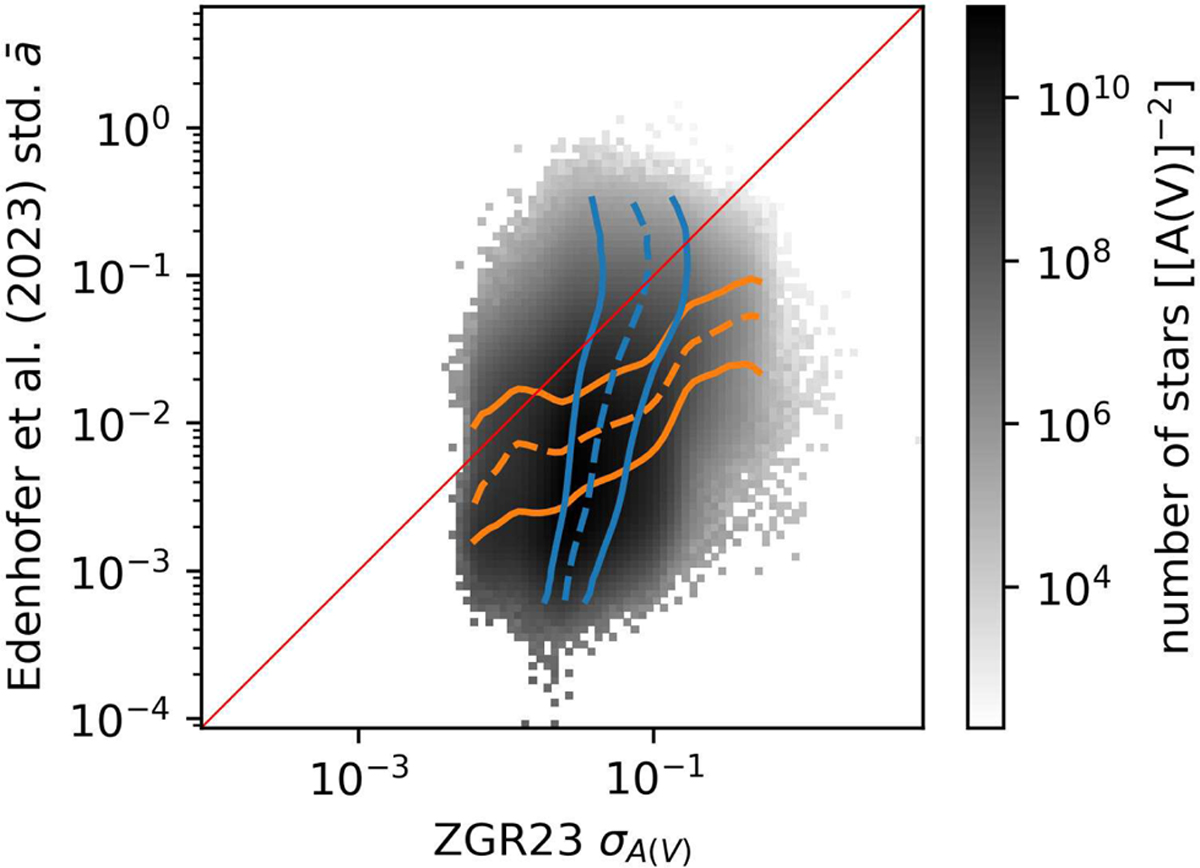
Similar to Figure D.1 but for the posterior standard deviation of our extinctions versus the ZGR23 uncertainties. The 16th, 50th, and 84th quantiles of the ZGR23 uncertainties for each bin of our standard deviation are shown as blue lines. The respective quantiles of our standard deviation in bins of the ZGR23 uncertainties are shown as orange lines. The bisectors are shown in red. The colorbars is logarithmic.
Current usage metrics show cumulative count of Article Views (full-text article views including HTML views, PDF and ePub downloads, according to the available data) and Abstracts Views on Vision4Press platform.
Data correspond to usage on the plateform after 2015. The current usage metrics is available 48-96 hours after online publication and is updated daily on week days.
Initial download of the metrics may take a while.