Fig. 12.
Download original image
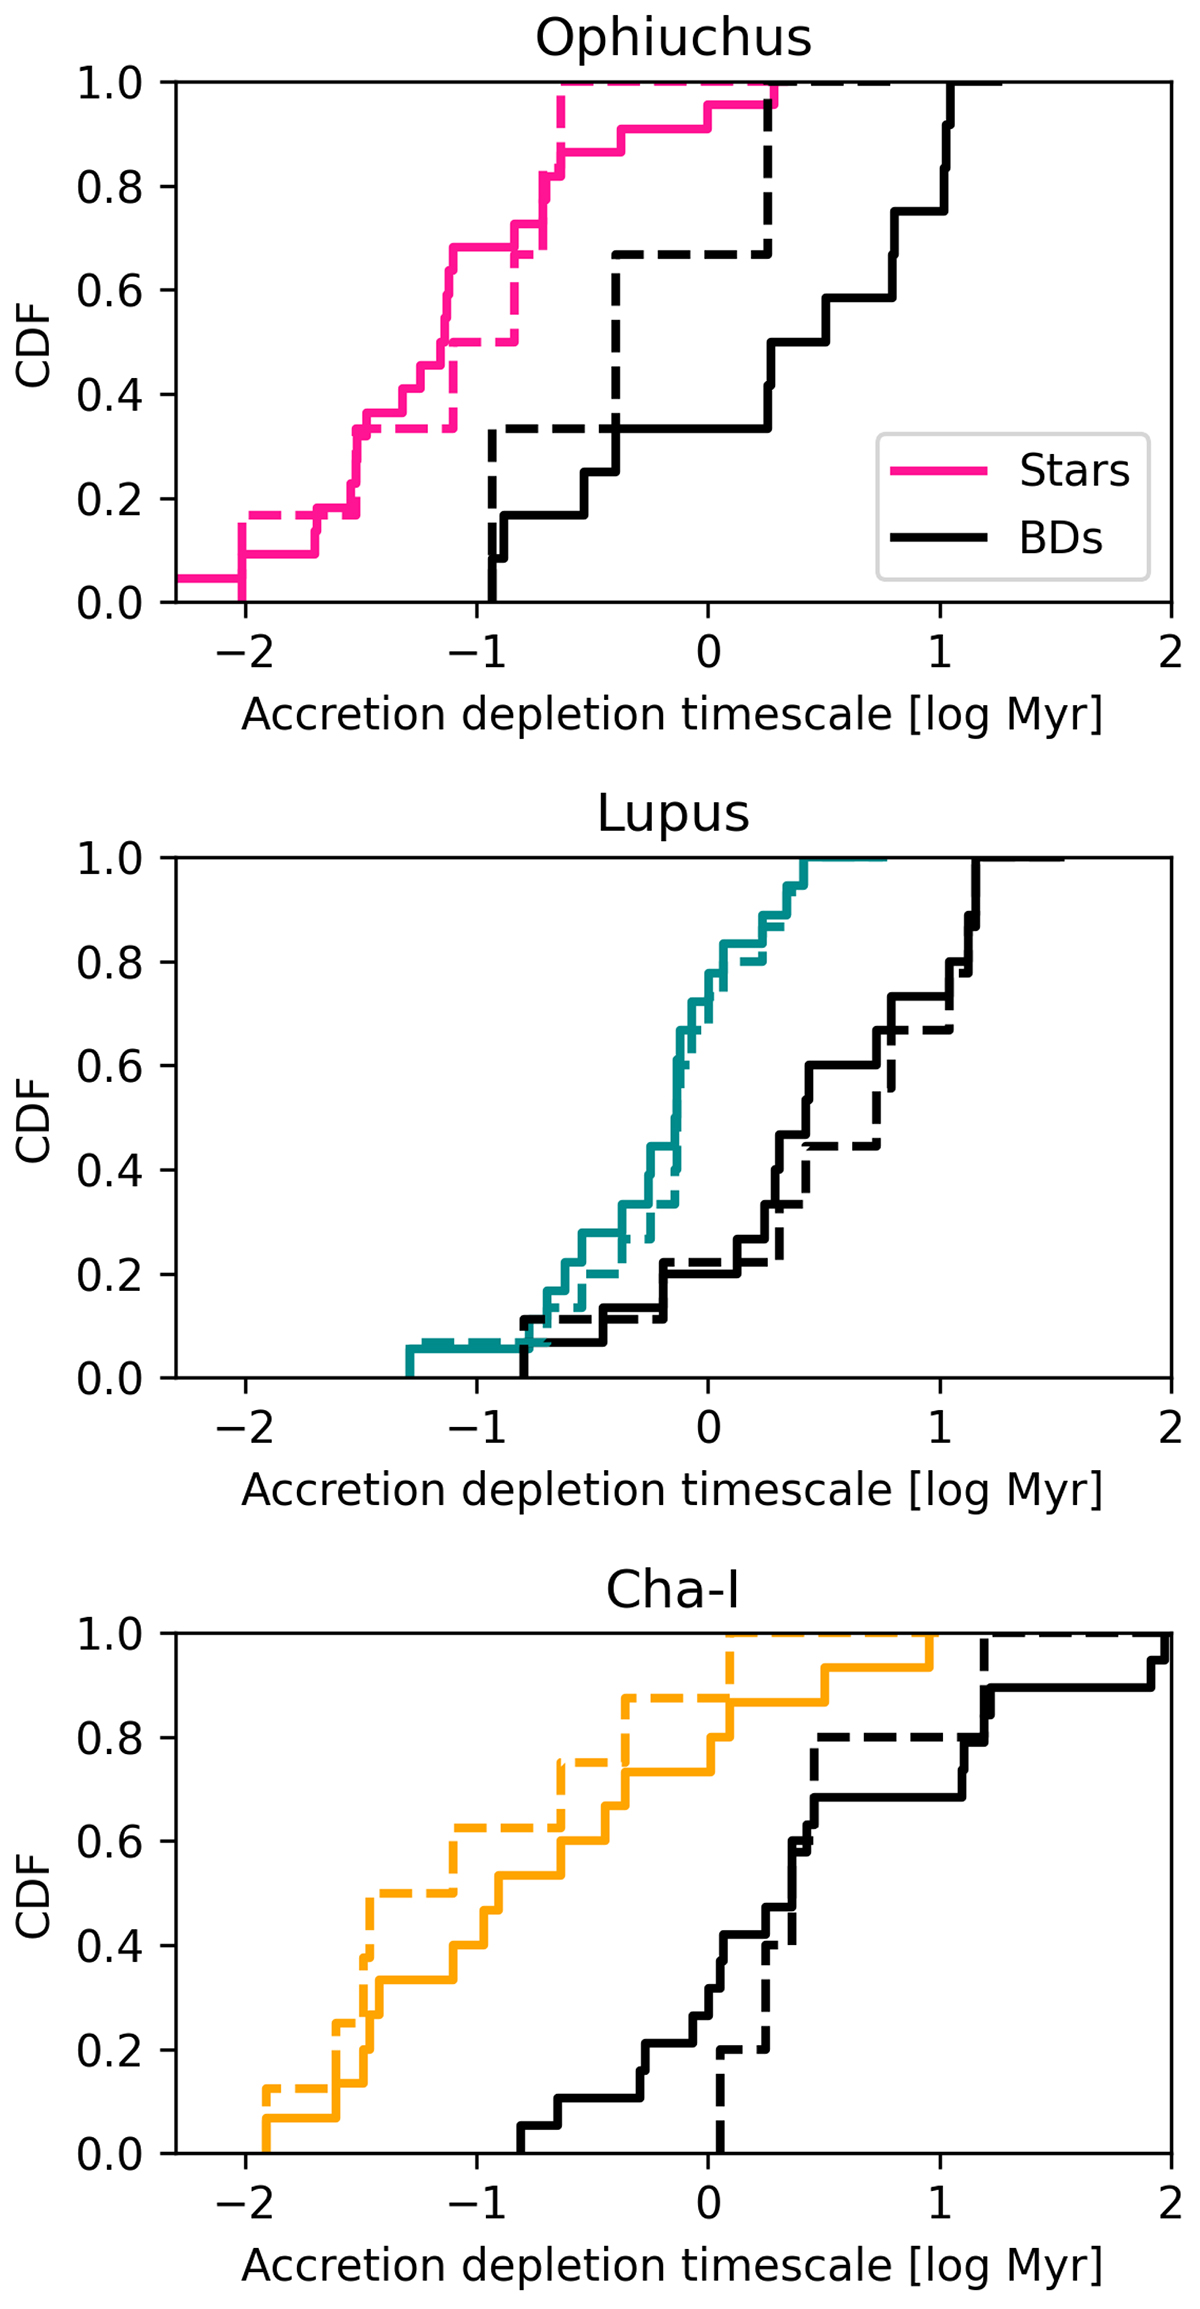
CDF of the accretion depletion timescale (Ṁacc/Mdisk) of Ophiuchus (top panel), Lupus (middle), and Cha-I (bottom). The black lines represent the CDF of BDs and the colored lines that of stars with Mdisk < 10−3 M⊙ (color-coded by region as in Fig. 5). The dashed lines represent the same CDF excluding the upper limit measurements.
Current usage metrics show cumulative count of Article Views (full-text article views including HTML views, PDF and ePub downloads, according to the available data) and Abstracts Views on Vision4Press platform.
Data correspond to usage on the plateform after 2015. The current usage metrics is available 48-96 hours after online publication and is updated daily on week days.
Initial download of the metrics may take a while.