Fig. 2.
Download original image
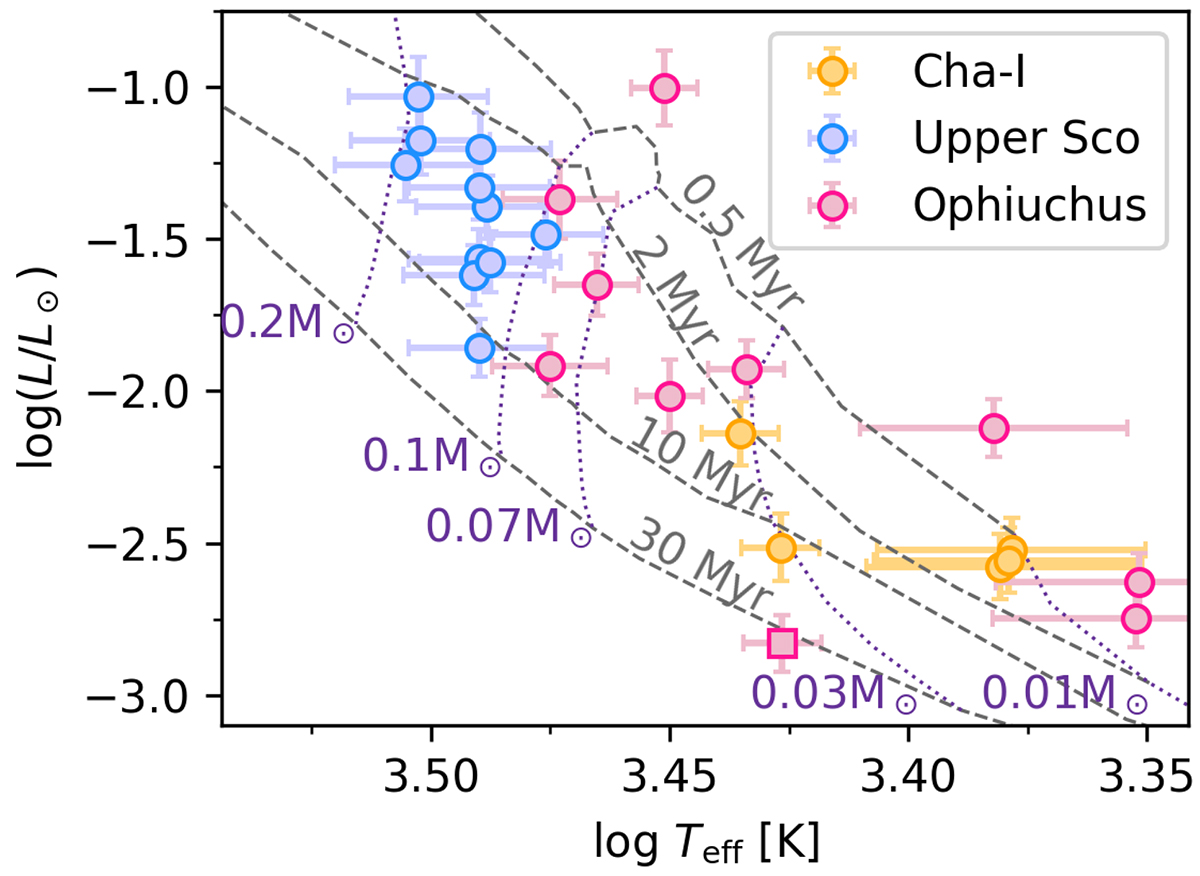
HR diagram of the sample presented in this work. The sources are color-coded following the same color-coding as in Fig. 1. The isochrones (black dashed lines, shown for 0.5, 2, 10, and 300 Myr) and the lines of constant mass (dark blue dotted lines, shown for 0.04, 0.07, 0.1, and 0.2 M⊙) shown are from Baraffe et al. (2015). Source CFHTWIR-Oph 77 is shown with a square to highlight its possible subluminous nature.
Current usage metrics show cumulative count of Article Views (full-text article views including HTML views, PDF and ePub downloads, according to the available data) and Abstracts Views on Vision4Press platform.
Data correspond to usage on the plateform after 2015. The current usage metrics is available 48-96 hours after online publication and is updated daily on week days.
Initial download of the metrics may take a while.