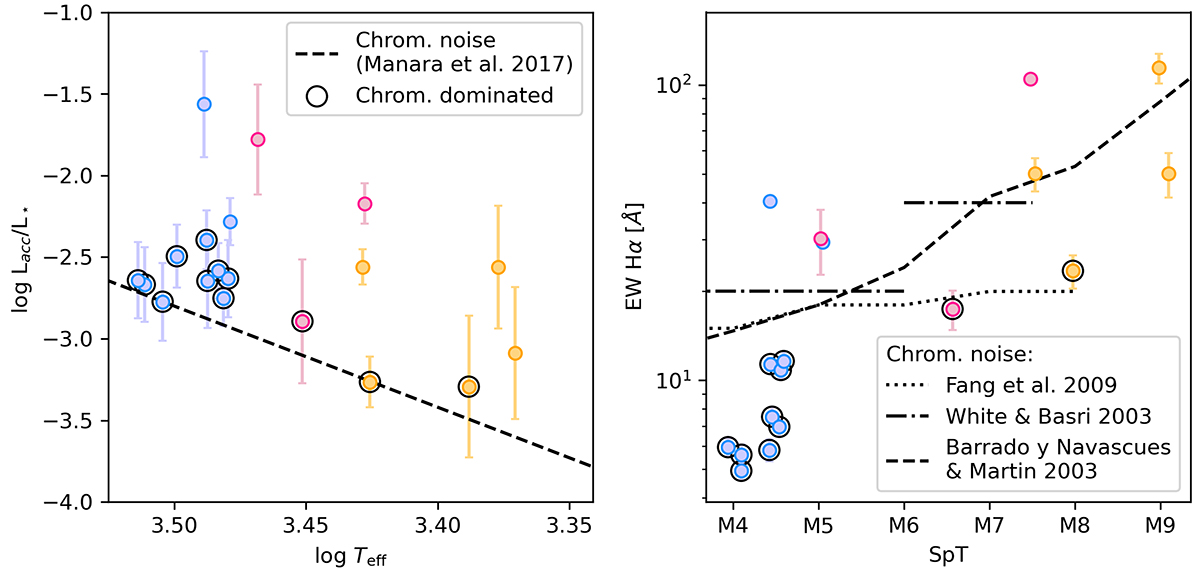
Fig. 3.
Download original image
Logarithm of the ratio between the accretion luminosity and the stellar luminosity as a function of log Teff (left panel). The black dashed line represents the boundary below which the impact of chromospheric emission on the observed accretion signatures becomes dominant. The symbols follow the same color-coding as in Fig. 1. EW of the Hα emission line as a function of SpT (right panel). We show the chromospheric-dominated boundary from Fang et al. (2009) with a black dotted line and the one from White & Basri (2003) with a dash-dotted line. We also show the saturation limit from Barrado y Navascués & Martín (2003) with a dashed line. In both panels we highlight the sources that may have a significant contribution in the measured accretion properties from the chromospheric activity with large empty black circles. A small offset in log Teff (left panel) and SpT (right panel) has been applied to all sources for clarity.
Current usage metrics show cumulative count of Article Views (full-text article views including HTML views, PDF and ePub downloads, according to the available data) and Abstracts Views on Vision4Press platform.
Data correspond to usage on the plateform after 2015. The current usage metrics is available 48-96 hours after online publication and is updated daily on week days.
Initial download of the metrics may take a while.