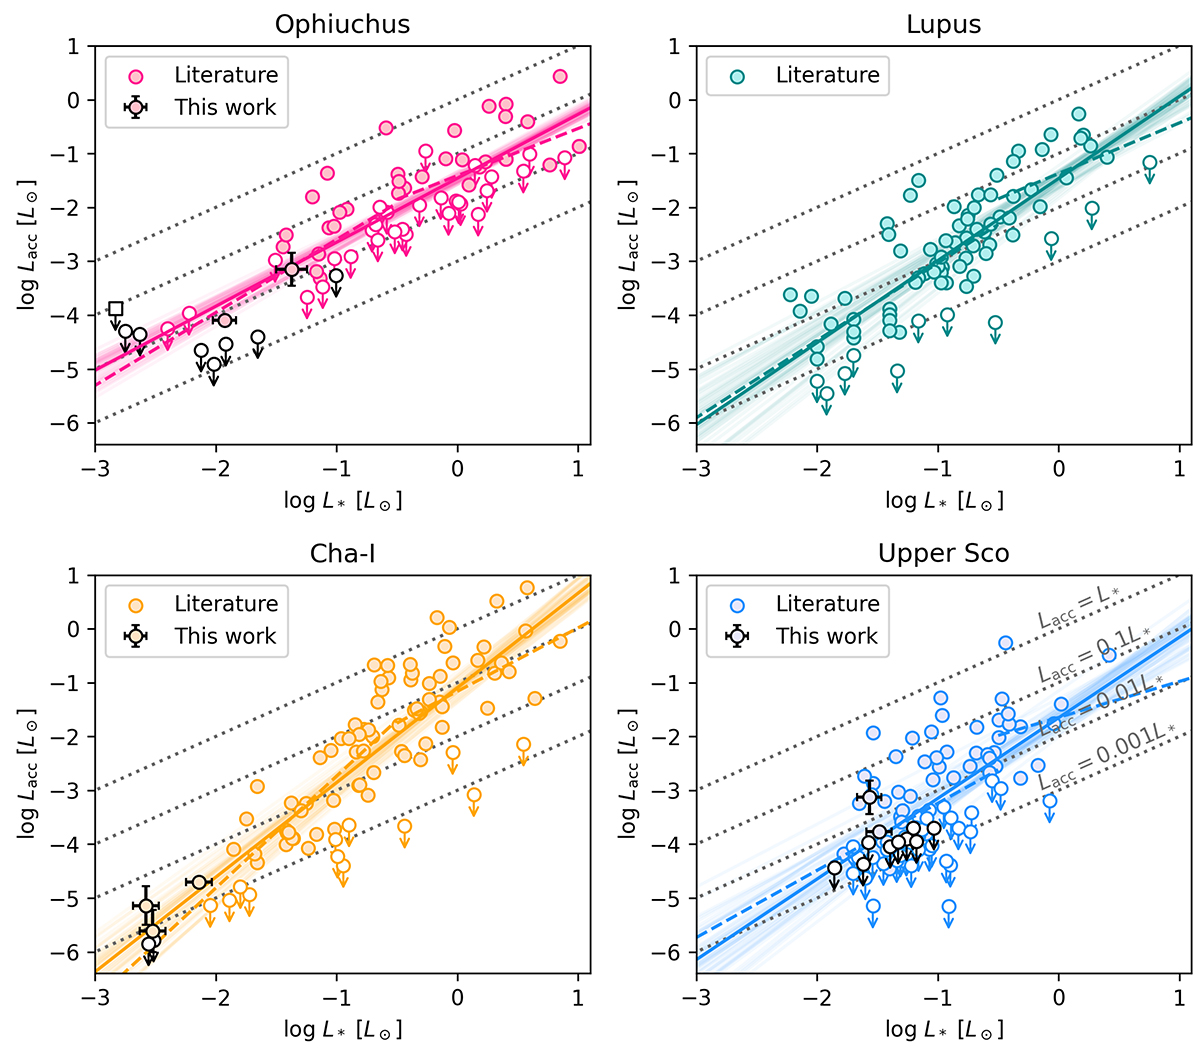
Fig. 5.
Download original image
log L* − log Lacc relationship for the four regions studied in this work: Ophiuchus (top left panel, pink), Lupus (top right panel, dark cyan), Cha-I (bottom left panel, orange), and Upper Scorpius (bottom right panel, blue). The data from the literature are shown in different colors, while the data presented in this work are shown with black circles. CFHTWIR-Oph 77 is represented in the top left panel with an empty black square to highlight its subluminous nature. We show the single and segmented power-law fits we have performed to the relationship in each region with solid and dashed lines, respectively. The light solid lines represent examples from the posterior distribution of the single power-law fit. The gray dotted lines mark the regions of constant Lacc/L* ratio (labeled in the lower-right panel).
Current usage metrics show cumulative count of Article Views (full-text article views including HTML views, PDF and ePub downloads, according to the available data) and Abstracts Views on Vision4Press platform.
Data correspond to usage on the plateform after 2015. The current usage metrics is available 48-96 hours after online publication and is updated daily on week days.
Initial download of the metrics may take a while.