Fig. 6.
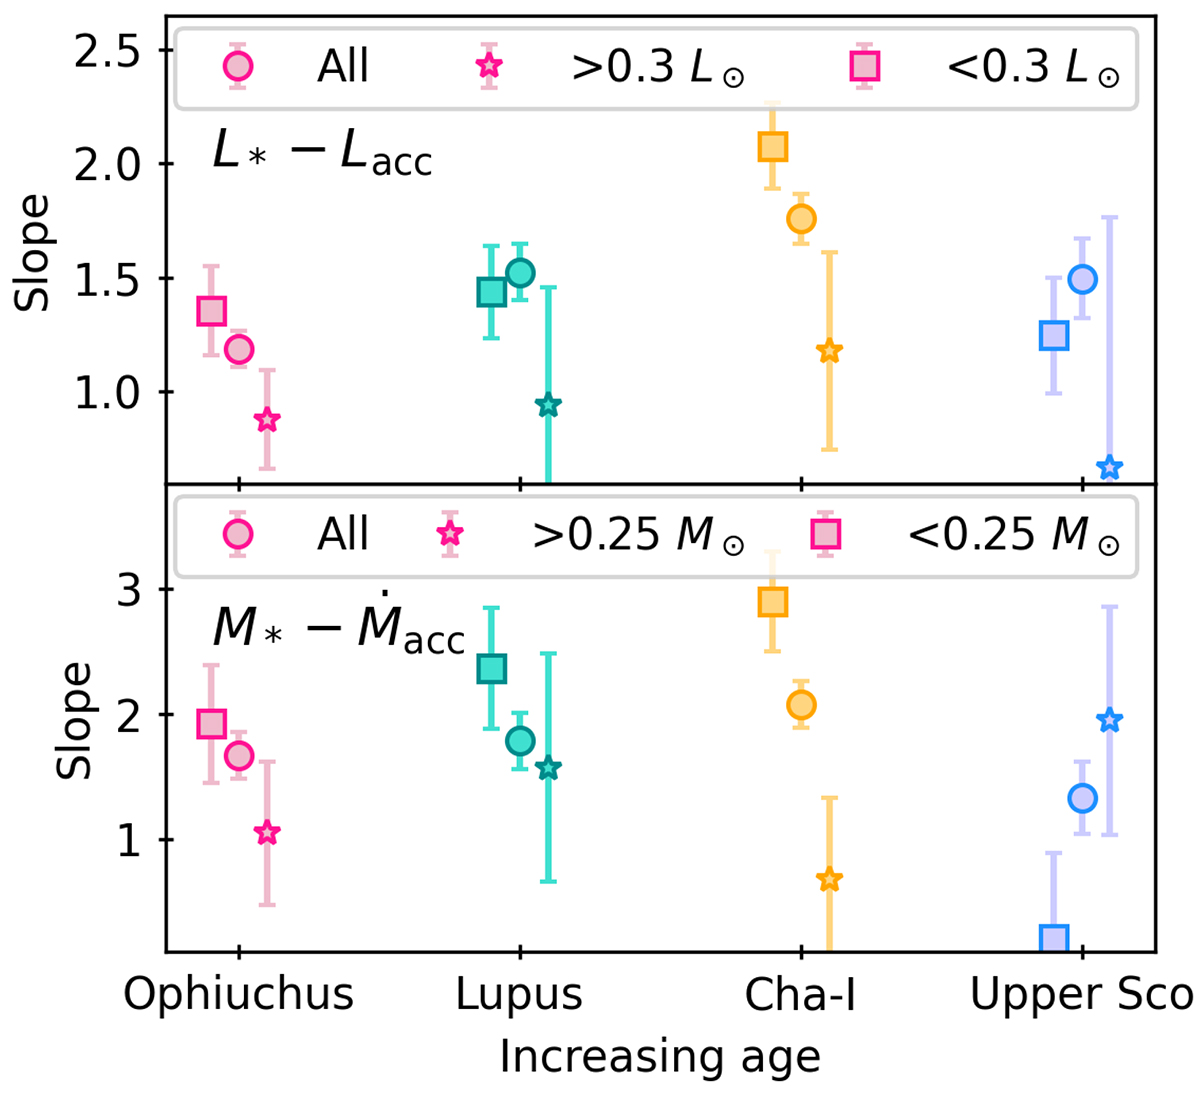
Download original image
Slope of the single and segmented power-law fits to the log L* − log Lacc (top panel) and log M∗ − log Ṁacc (bottom panel) relationships for the four regions studied in this work. The slopes of the single power-law fits are shown with circles, of the faint and low-mass samples with squares and the bright and high-mass samples with stars. A small offset in age in the slopes of each region was performed for visualization purposes. The symbols follow the same color-coding as in Fig. 5.
Current usage metrics show cumulative count of Article Views (full-text article views including HTML views, PDF and ePub downloads, according to the available data) and Abstracts Views on Vision4Press platform.
Data correspond to usage on the plateform after 2015. The current usage metrics is available 48-96 hours after online publication and is updated daily on week days.
Initial download of the metrics may take a while.