Fig. 8.
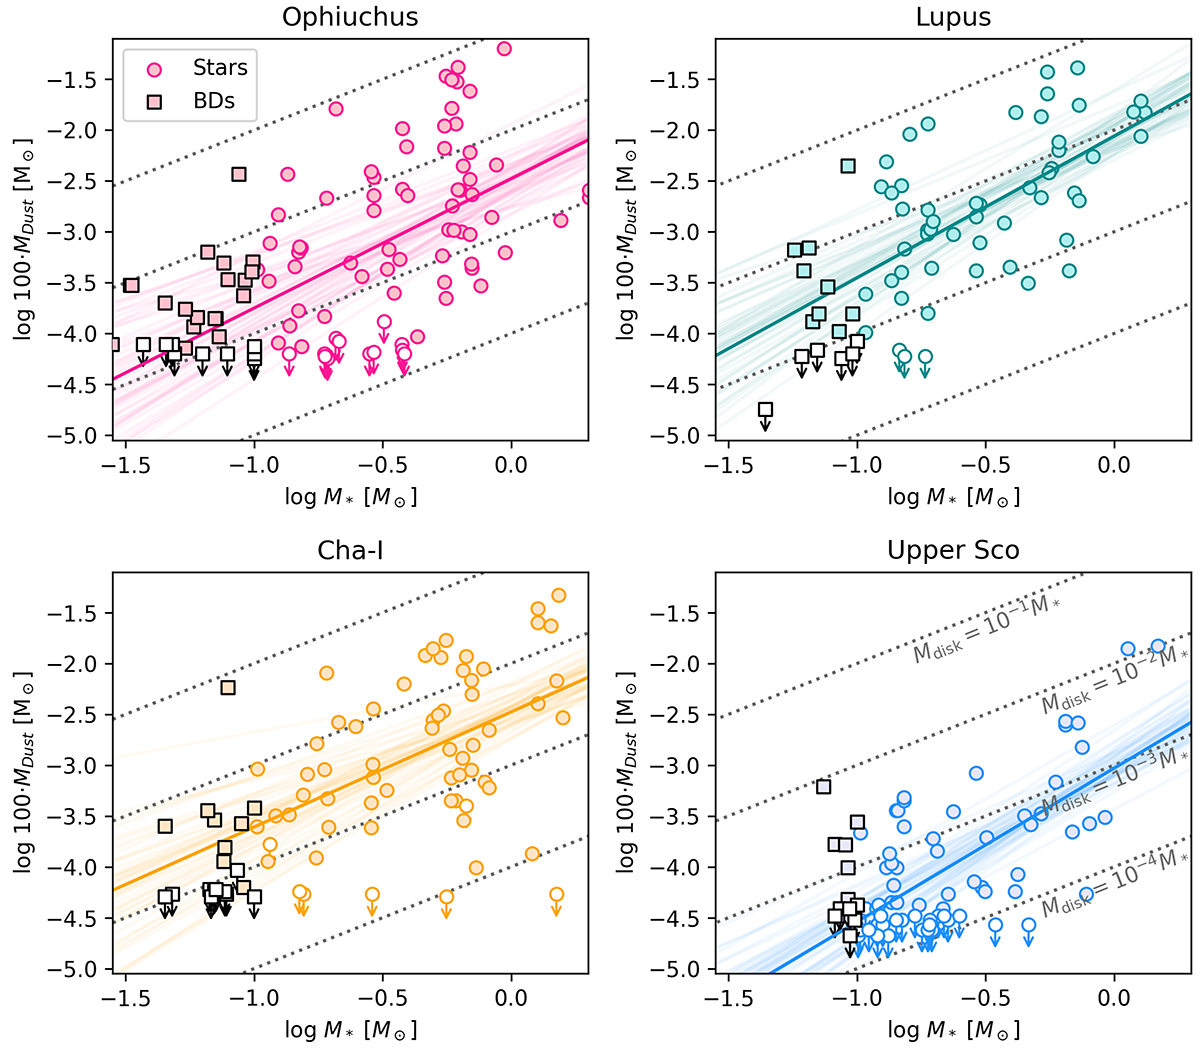
Download original image
log M* − log Mdisk relationship for the four regions studied in this work: Ophiuchus (top left panel), Lupus (top right panel), Cha-I (bottom left panel), and Upper Scorpius (bottom right panel). The symbols follow the same color-coding as in Fig. 5. The stars are represented with circles and the BDs are represented as black squares. The solid lines represent the single power-law fits performed to the relationship in each region. The gray dotted lines mark the regions of constant Mdisk/M* ratio.
Current usage metrics show cumulative count of Article Views (full-text article views including HTML views, PDF and ePub downloads, according to the available data) and Abstracts Views on Vision4Press platform.
Data correspond to usage on the plateform after 2015. The current usage metrics is available 48-96 hours after online publication and is updated daily on week days.
Initial download of the metrics may take a while.