Fig. 9.
Download original image
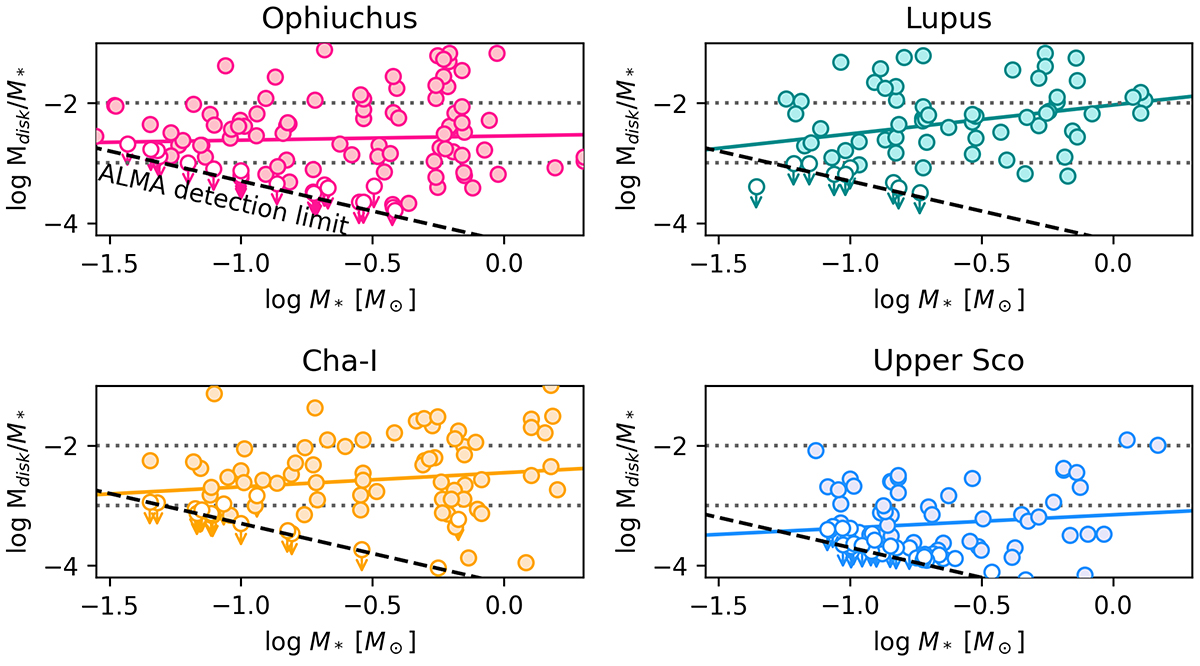
Ratio between disk mass and stellar mass as a function of the stellar mass for the Ophiuchus (top panel), Lupus (top middle panel), Cha-I (bottom middle panel), and Upper Scorpius (bottom panel) star-forming regions. The black dashed line represents the ALMA detection limit of the surveys in each region. The colored solid lines represent the power-law fit to the M* − Mdisk relationship performed in Sect. 4.3 and the gray dotted lines represent lines of constant Mdisk/M* ratio. The symbols follow the same color-coding as in Fig. 5.
Current usage metrics show cumulative count of Article Views (full-text article views including HTML views, PDF and ePub downloads, according to the available data) and Abstracts Views on Vision4Press platform.
Data correspond to usage on the plateform after 2015. The current usage metrics is available 48-96 hours after online publication and is updated daily on week days.
Initial download of the metrics may take a while.