Open Access
Fig. 2
Download original image
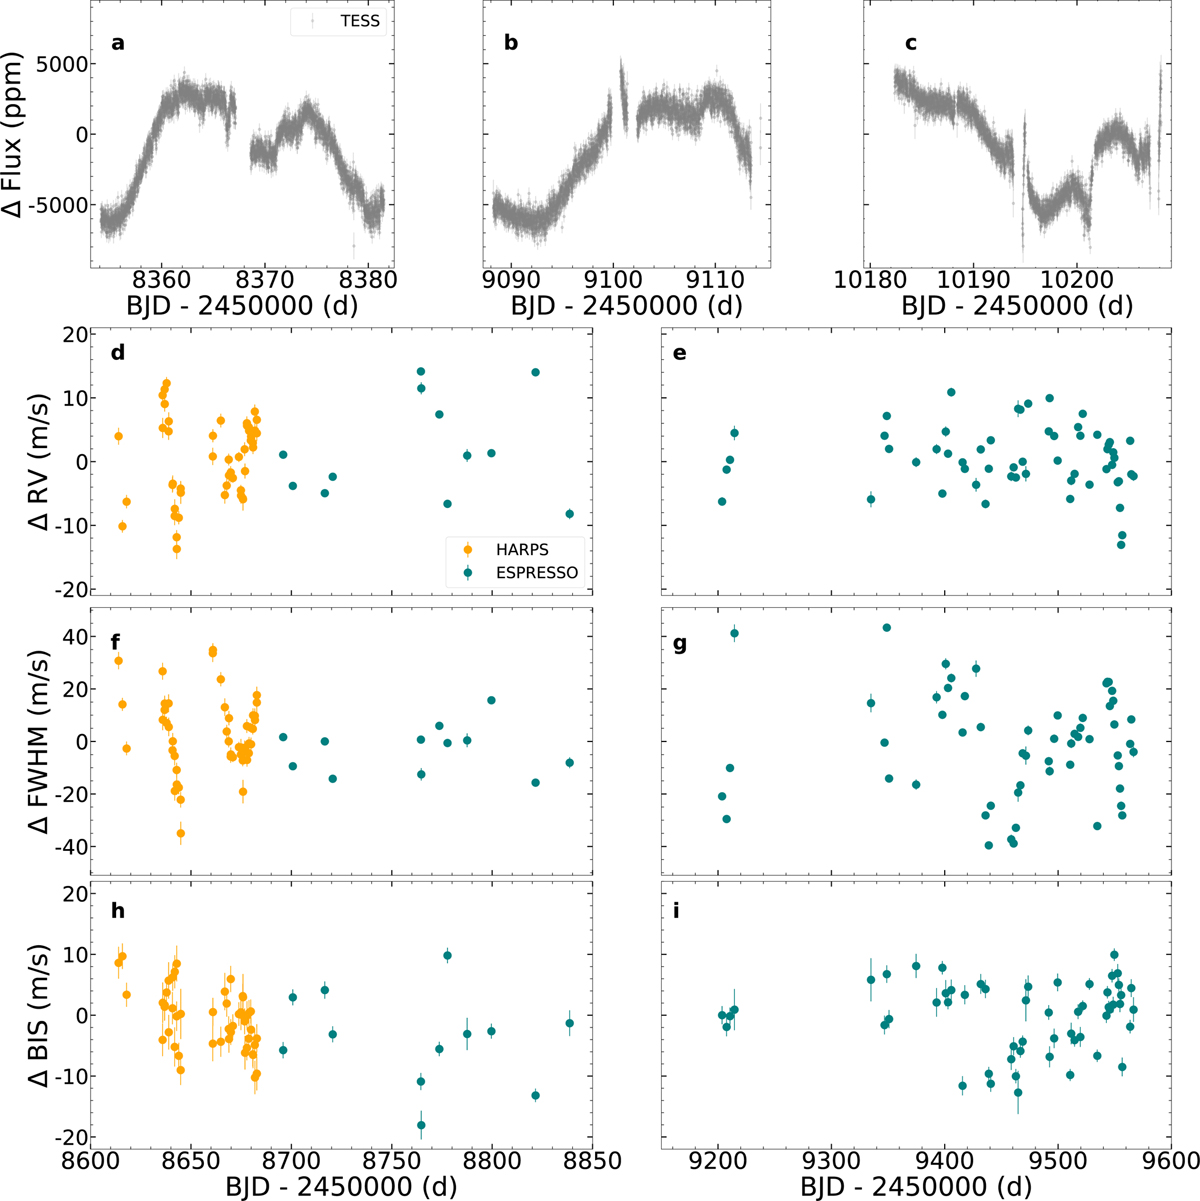
Data used in the global analysis. Panels a, b and c show TESS data of sectors 2, 29, and 69, respectively. Panels d and e show the RV data obtained during the 2019 and 2020-2021 campaigns, respectively. Panels f and g show the FWHM time series, and panels h and i show the bisector span time series.
Current usage metrics show cumulative count of Article Views (full-text article views including HTML views, PDF and ePub downloads, according to the available data) and Abstracts Views on Vision4Press platform.
Data correspond to usage on the plateform after 2015. The current usage metrics is available 48-96 hours after online publication and is updated daily on week days.
Initial download of the metrics may take a while.