Open Access
Fig. 20
Download original image
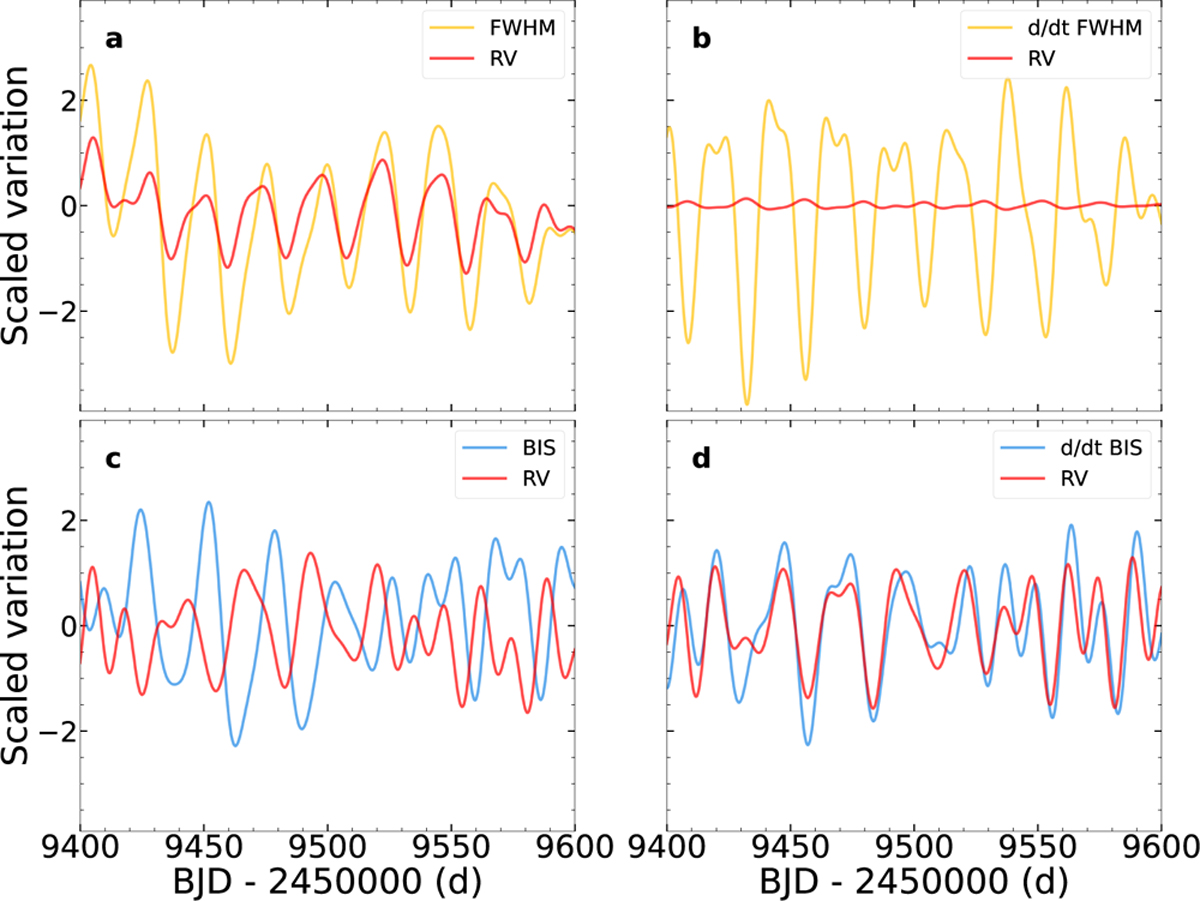
Individual components of the activity model. Panel a shows the scaled variations of the FWHM model and their effect in RV. Panel b show the scaled variations of the gradient of the FWHM and their effect in RV. Panels c and d show the same for the bisector model.
Current usage metrics show cumulative count of Article Views (full-text article views including HTML views, PDF and ePub downloads, according to the available data) and Abstracts Views on Vision4Press platform.
Data correspond to usage on the plateform after 2015. The current usage metrics is available 48-96 hours after online publication and is updated daily on week days.
Initial download of the metrics may take a while.