Fig. A.1
Download original image
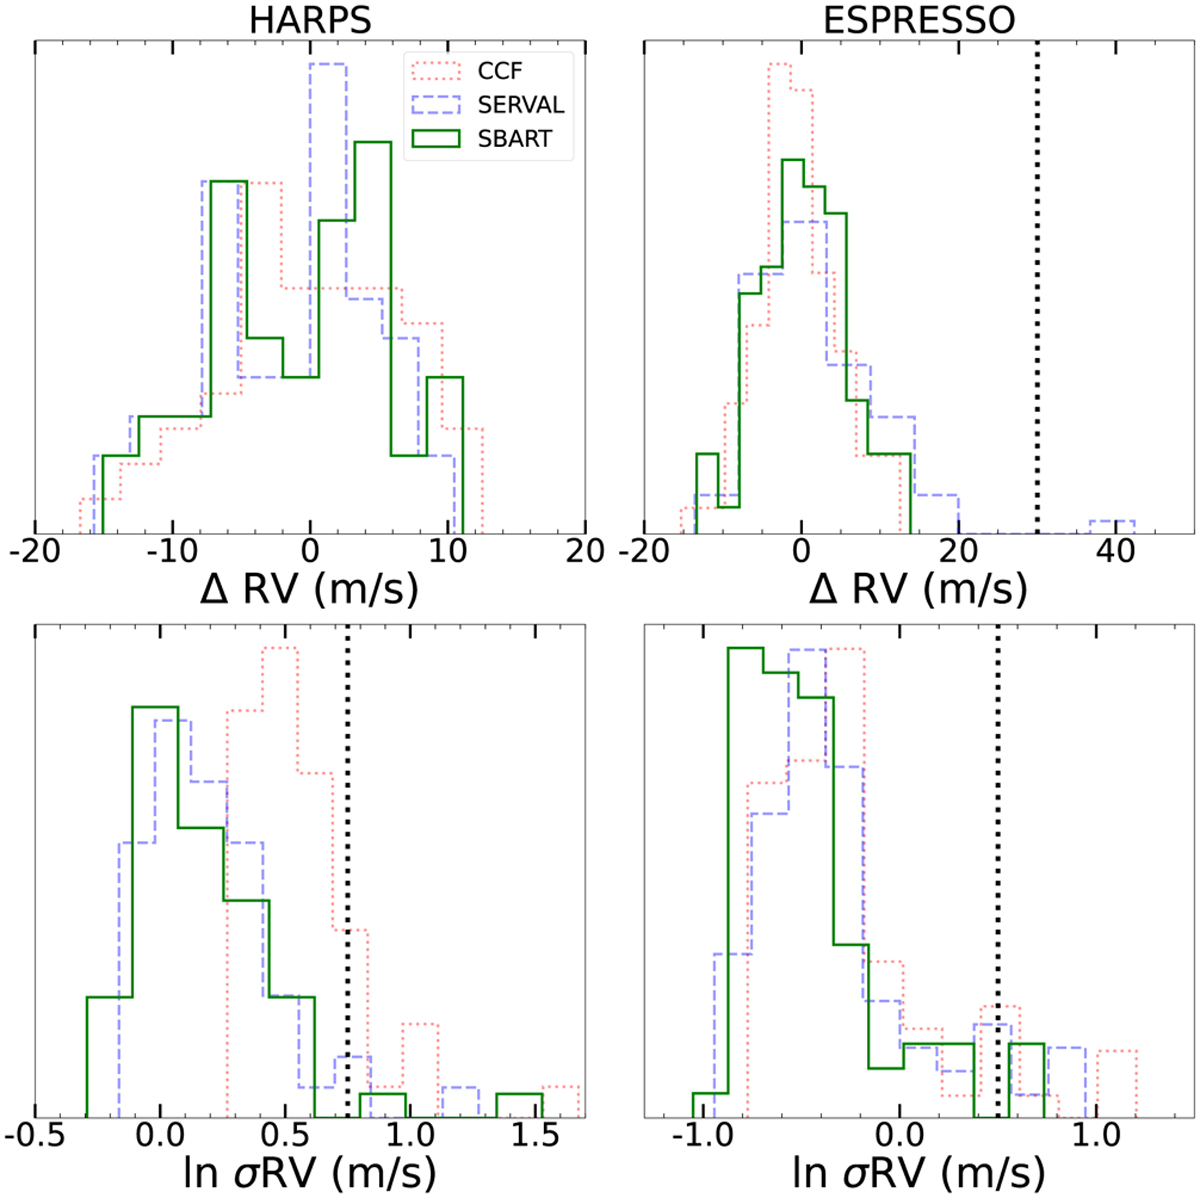
Histogram of the RV and error measurements for all RV extractions tested. The top panels show the distribution of RV measurements obtained for HARPS (left) and ESPRESSO (right). The bottom panels show the distribution of internal errors for HARPS (left) and ESPRESSO (right), in logarithmic scale. The vertical lines show the thresholds used for the outlier rejection procedure.
Current usage metrics show cumulative count of Article Views (full-text article views including HTML views, PDF and ePub downloads, according to the available data) and Abstracts Views on Vision4Press platform.
Data correspond to usage on the plateform after 2015. The current usage metrics is available 48-96 hours after online publication and is updated daily on week days.
Initial download of the metrics may take a while.