Open Access
Fig. A.3
Download original image
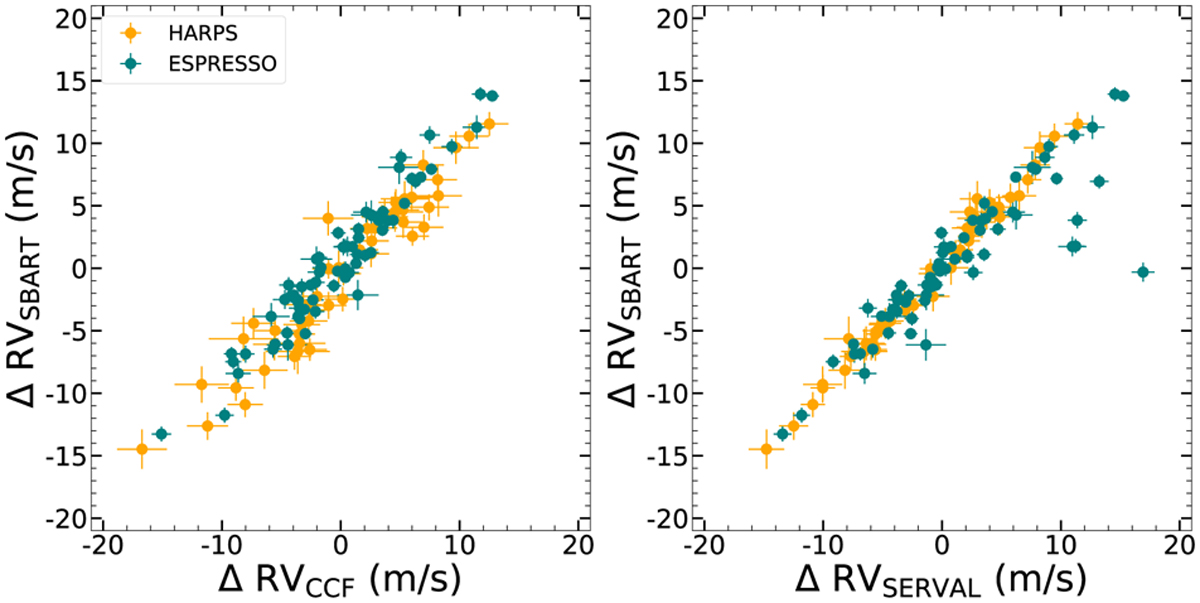
Comparison of the velocities coming from SBART with the CCF and SERVAL. The left panel shows the HARPS (orange) and ESPRESSO (teal) RVs computed with SBART compared to the CCF RVs. The right panel shows the HARPS (orange) and ESPRESSO (teal) RVs computed with SBART compared to the SERVAL RVs.
Current usage metrics show cumulative count of Article Views (full-text article views including HTML views, PDF and ePub downloads, according to the available data) and Abstracts Views on Vision4Press platform.
Data correspond to usage on the plateform after 2015. The current usage metrics is available 48-96 hours after online publication and is updated daily on week days.
Initial download of the metrics may take a while.