Fig. B.2
Download original image
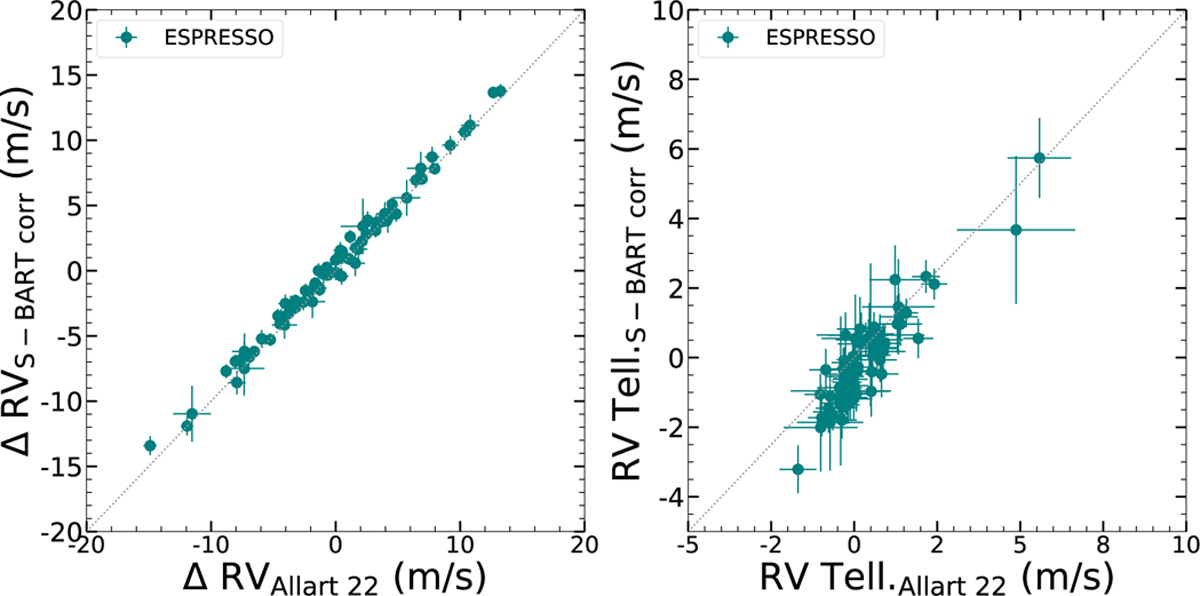
Comparison of the RV derived from different telluric correction algorithms. The left panels show the comparison between the corrected RVs obtained with the telluric correction of S–BART and with the correction of Allart et al. (2022) The right panels show the comparison between the telluric RVs. The dotted grey lines show the one-to-one relationship.
Current usage metrics show cumulative count of Article Views (full-text article views including HTML views, PDF and ePub downloads, according to the available data) and Abstracts Views on Vision4Press platform.
Data correspond to usage on the plateform after 2015. The current usage metrics is available 48-96 hours after online publication and is updated daily on week days.
Initial download of the metrics may take a while.