Open Access
Fig. B.3
Download original image
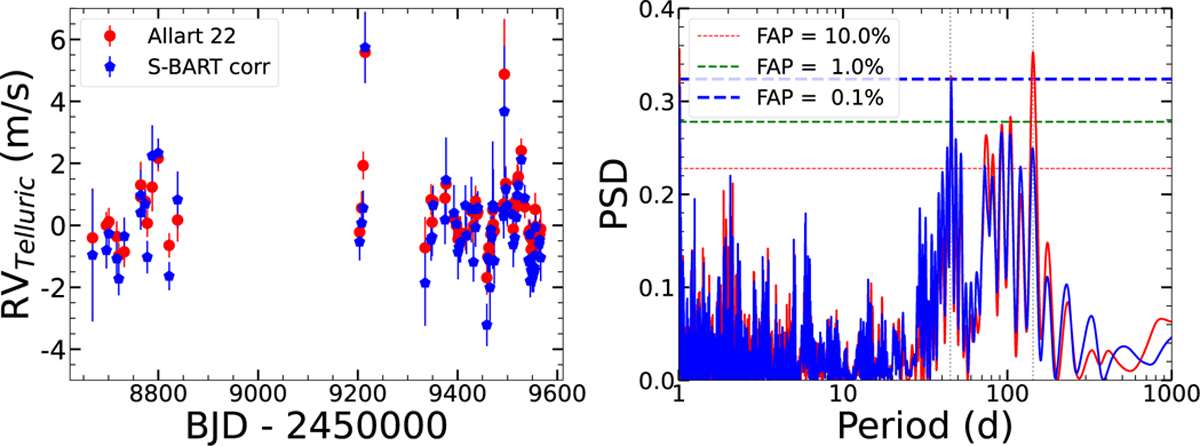
Telluric RVs and their periodogram. The left panel show the telluric RV measurements obtained with the algorithm of Allart et al. (2022) and with S–BART. The right panel shows the GLS periodogram of both datasets. The vertical grey lines highlight the most significant periods, of 45 and 140 days.
Current usage metrics show cumulative count of Article Views (full-text article views including HTML views, PDF and ePub downloads, according to the available data) and Abstracts Views on Vision4Press platform.
Data correspond to usage on the plateform after 2015. The current usage metrics is available 48-96 hours after online publication and is updated daily on week days.
Initial download of the metrics may take a while.