Fig. 8
Download original image
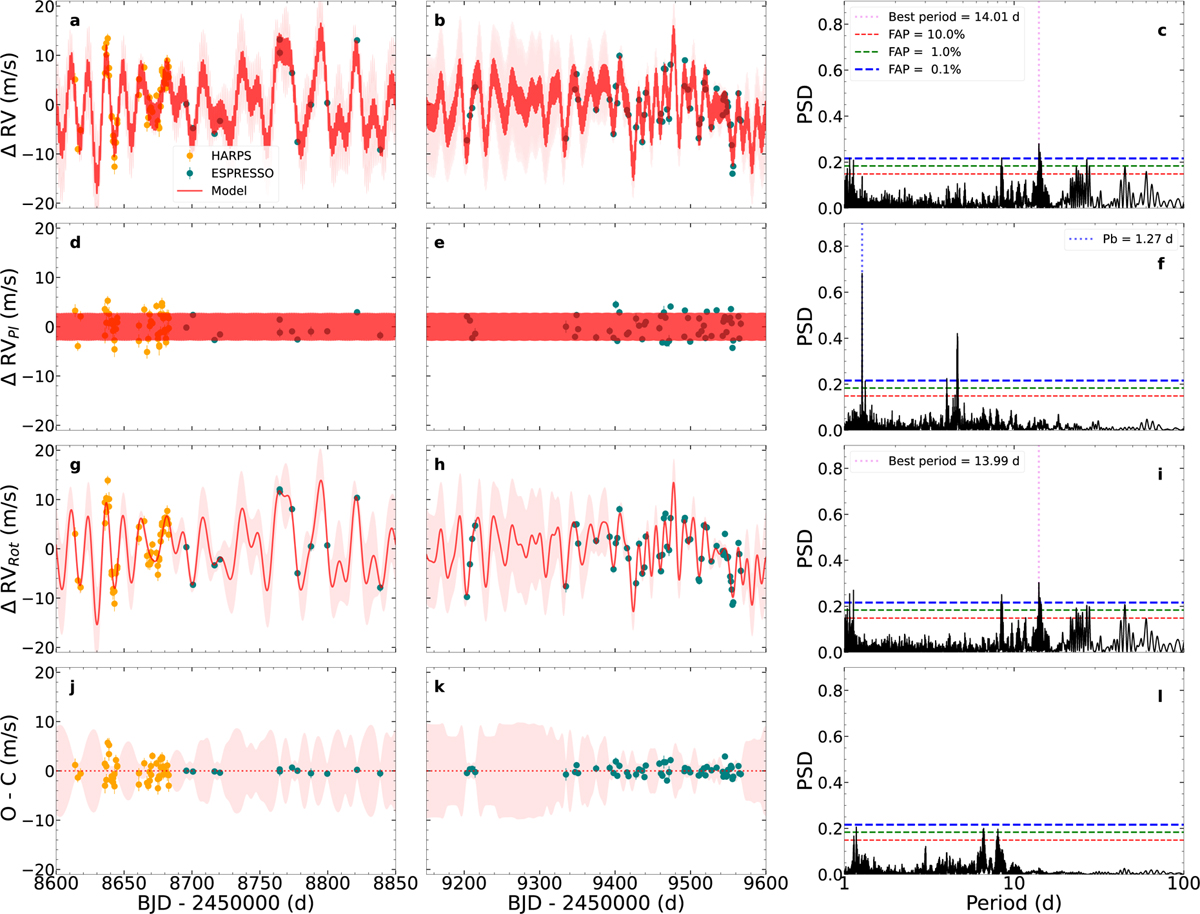
RV time series with the best model fit (GP+1p). Panels a and b show the RV time series with the best GP+1p model. Panel c shows the GLS periodogram of the raw RV data. Panels d and e show the RV data detrended from stellar activity (i.e. planetary component). Panel f shows the GLS periodogram of the detrended RV time series. Panels g and h show the RV data detrended from the planetary component (i.e. stellar activity). Panel i shows the GLS periodogram of the activity-induced RVs. Panels j and k show the residuals after the fit. Panel i shows the GLS periodogram of the residuals.
Current usage metrics show cumulative count of Article Views (full-text article views including HTML views, PDF and ePub downloads, according to the available data) and Abstracts Views on Vision4Press platform.
Data correspond to usage on the plateform after 2015. The current usage metrics is available 48-96 hours after online publication and is updated daily on week days.
Initial download of the metrics may take a while.