Fig. 9
Download original image
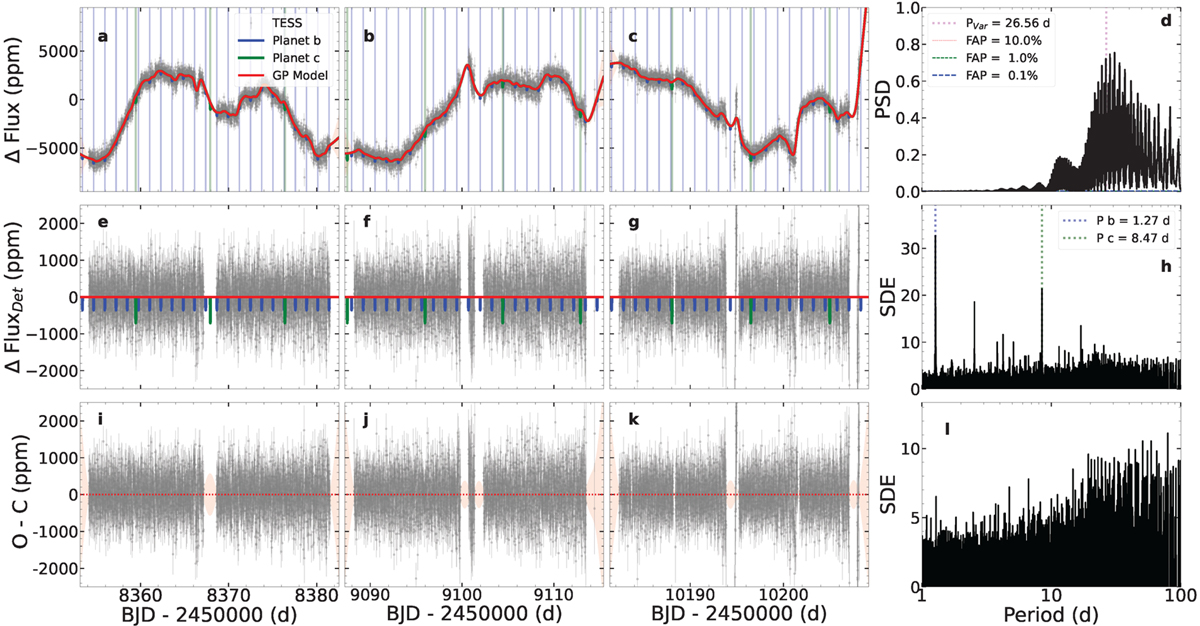
TESS data with the best model fit (GP+2p). Panels a, b, and c, show the TESS light curve with the best GP+1p model. The blue and green lines show the transits at the periods of 1.27 days, and 8.47 days, respectively. Panel d shows the GLS periodogram of the TESS data. Panels e, f, and g, show the detrended TESS data along with the best fit model of both planets. Panel h shows the TLS periodogram of the detrended light curve. Panels i, j, and k show the residuals after the fit of the best GP+1p model. Panel i shows the TLS periodogram of the residuals.
Current usage metrics show cumulative count of Article Views (full-text article views including HTML views, PDF and ePub downloads, according to the available data) and Abstracts Views on Vision4Press platform.
Data correspond to usage on the plateform after 2015. The current usage metrics is available 48-96 hours after online publication and is updated daily on week days.
Initial download of the metrics may take a while.