Fig. 3.
Download original image
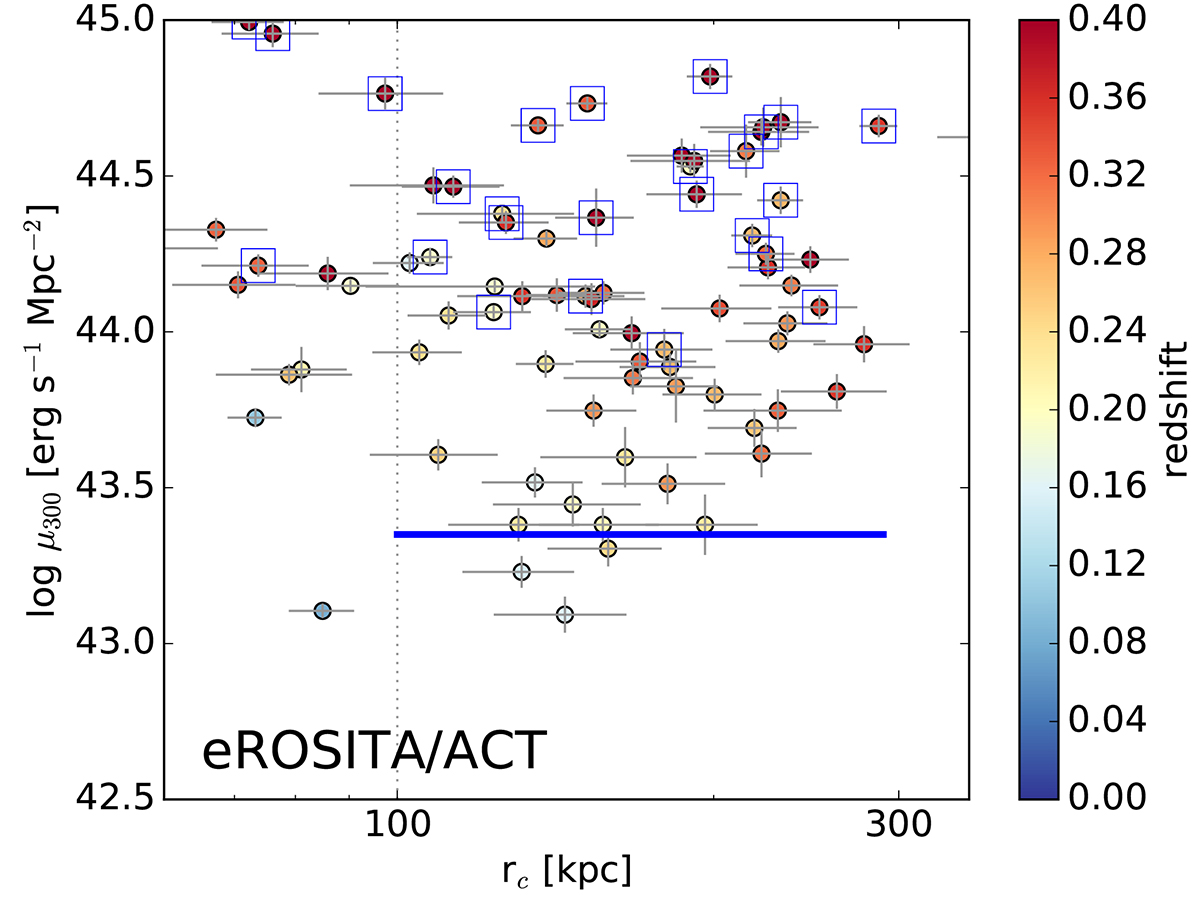
Mean surface brightness within 300 kpc vs. core radius, color-coded by redshift (useful for the comparison with Fig. 2 and for the discussion) for clusters in eFEDS. Clusters that are also detected in the ACT survey are marked with a square. About 5% of the eFEDS clusters have a mean surface brightness below 43.35 erg s−1 Mpc−2 vs. about one quarter in the XUCS sample. The ACT survey only detects the clusters with a higher surface brightness. The vertical dotted line marks the minimum core radius we considered to compute the fraction of clusters with a low surface brightness. As for the XXL-100 sample, correcting luminosities for evolution would not significantly alter the results.
Current usage metrics show cumulative count of Article Views (full-text article views including HTML views, PDF and ePub downloads, according to the available data) and Abstracts Views on Vision4Press platform.
Data correspond to usage on the plateform after 2015. The current usage metrics is available 48-96 hours after online publication and is updated daily on week days.
Initial download of the metrics may take a while.