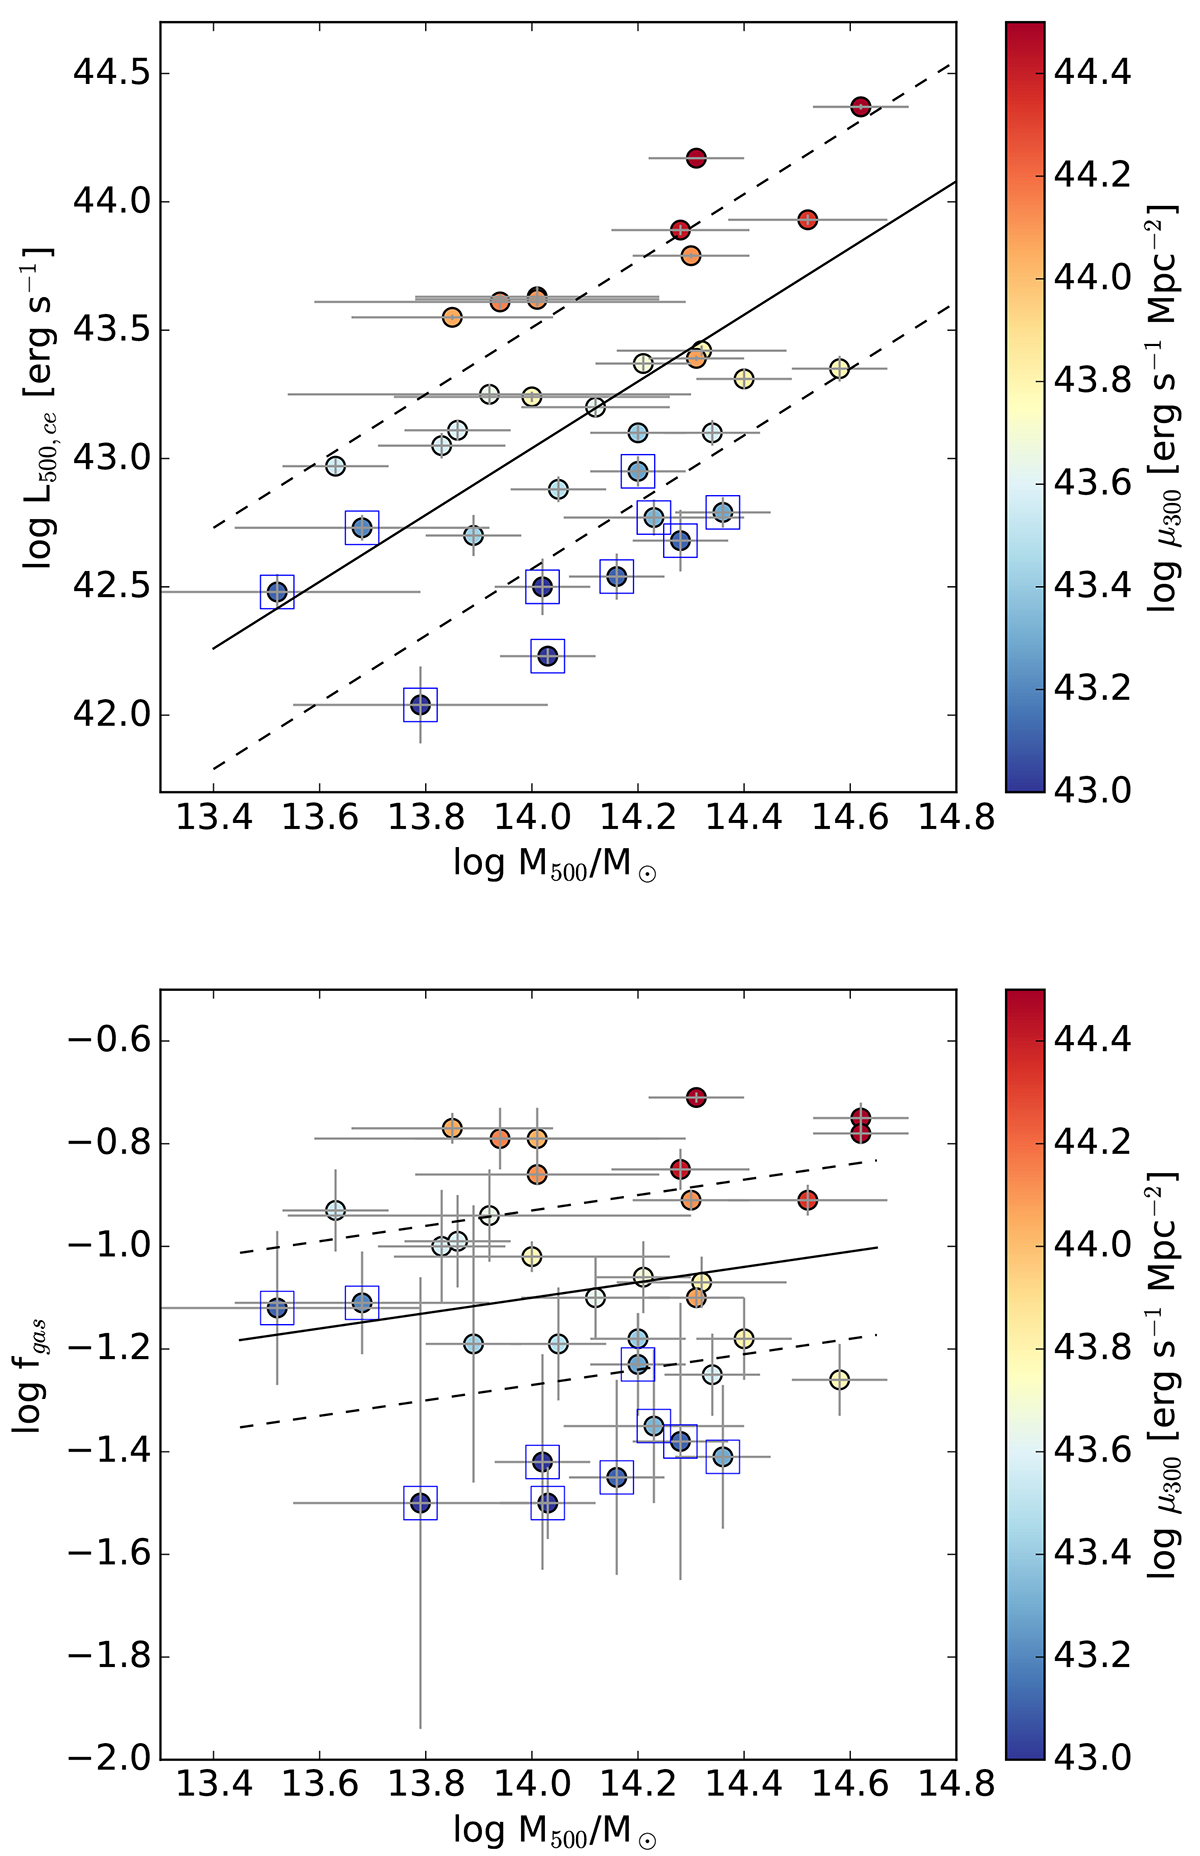
Fig. 7.
Download original image
Core-excised [0.5–2] keV luminosity (upper panel) and gas fraction (bottom panel) within r500 vs. M500 color-coded by brightness within 300 kpc for the XUCS sample. The solid black line and the dashed corridor indicate the mean relation and the ±1σintr regions derived in Papers I and II. Low surface brightness clusters (with μ300 < 43.35 erg s−1 Mpc−2) are indicated by squares and are mostly clusters that are X-ray faint for their mass and have a low gas fraction (near or below the lower dashed line) with some contamination by objects with an average gas fraction that are faint because the mass is low (near the solid line). We plot the measurements from two different telescopes for three telescopes, although it can be challenging to identify these duplicates in the plot.
Current usage metrics show cumulative count of Article Views (full-text article views including HTML views, PDF and ePub downloads, according to the available data) and Abstracts Views on Vision4Press platform.
Data correspond to usage on the plateform after 2015. The current usage metrics is available 48-96 hours after online publication and is updated daily on week days.
Initial download of the metrics may take a while.