Fig. 4
Download original image
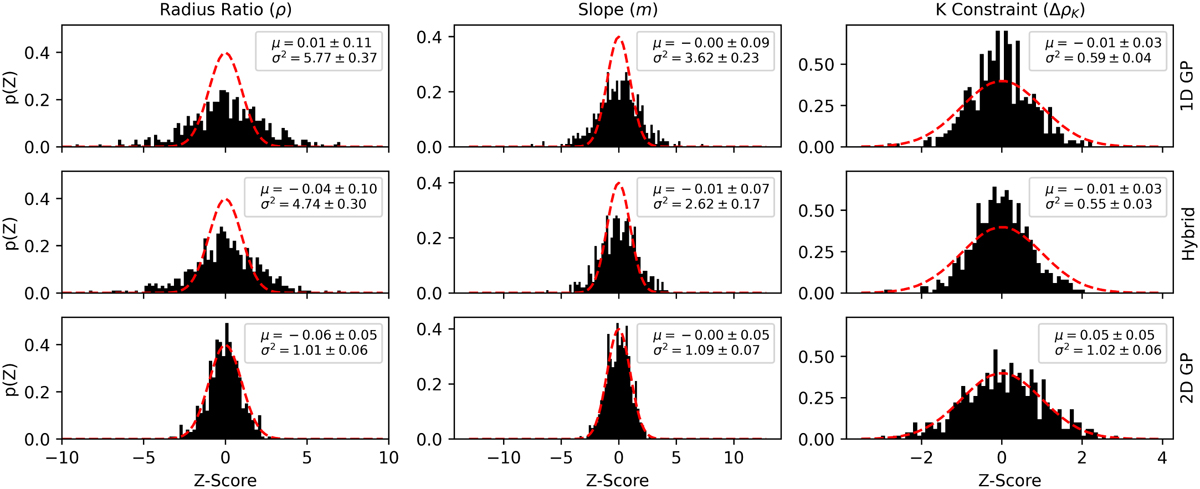
Z-scores of retrieved atmospheric features from Simulation 2, which had short wavelength length scale correlated noise. The three methods tested were fitting the light curves with 1D GPs (top row), the Hybrid method (middle row) and a 2D GP (bottom row). All methods have mean Z-scores consistent with zero, that is none of them biases the results towards measuring larger or smaller values of the features. The retrieved variance of Z-scores for the 2D GP method are all consistent with a variance of one (matching the Gaussian distribution plotted in red), but not for the other methods, which indicates overestimation or underestimation of uncertainties.
Current usage metrics show cumulative count of Article Views (full-text article views including HTML views, PDF and ePub downloads, according to the available data) and Abstracts Views on Vision4Press platform.
Data correspond to usage on the plateform after 2015. The current usage metrics is available 48-96 hours after online publication and is updated daily on week days.
Initial download of the metrics may take a while.