Fig. 6
Download original image
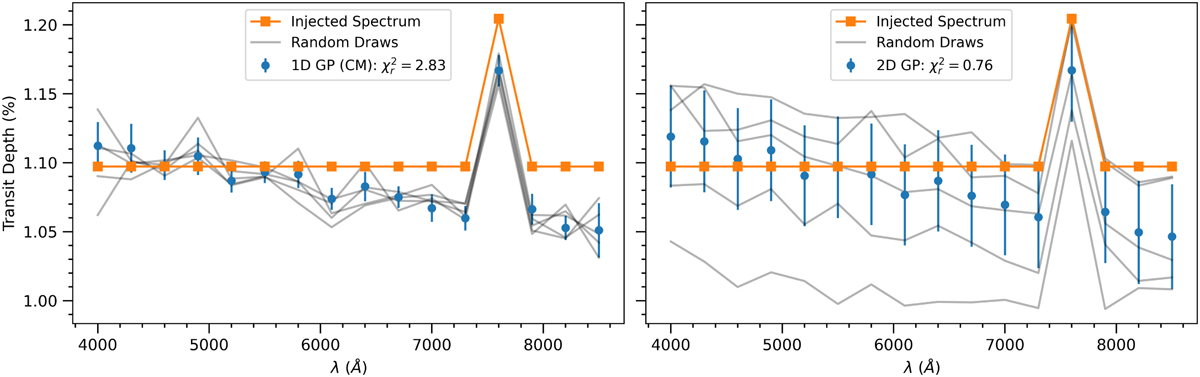
Example of retrieved transmission spectra with 1D GP method (left) analysing common-mode corrected light curves (right plot in Fig. 5) compared with 2D GP method (right) analysing uncorrected light curves (left plot in Fig. 5). The error bars in blue only convey the mean and standard deviation of each transit depth measurement, random draws are taken from the covariance matrix to convey potential correlations between transit depths, helping to visualise the increased uncertainty in the offset and scattering slope of the spectrum from the 2D GP method. Only the 1D GP method erroneously detects a negative scattering slope. While it is not visually apparent, the 2D GP method gives a stronger constraint on the detection of potassium (13.9σ compared to 8.7σ).
Current usage metrics show cumulative count of Article Views (full-text article views including HTML views, PDF and ePub downloads, according to the available data) and Abstracts Views on Vision4Press platform.
Data correspond to usage on the plateform after 2015. The current usage metrics is available 48-96 hours after online publication and is updated daily on week days.
Initial download of the metrics may take a while.