Fig. 3
Download original image
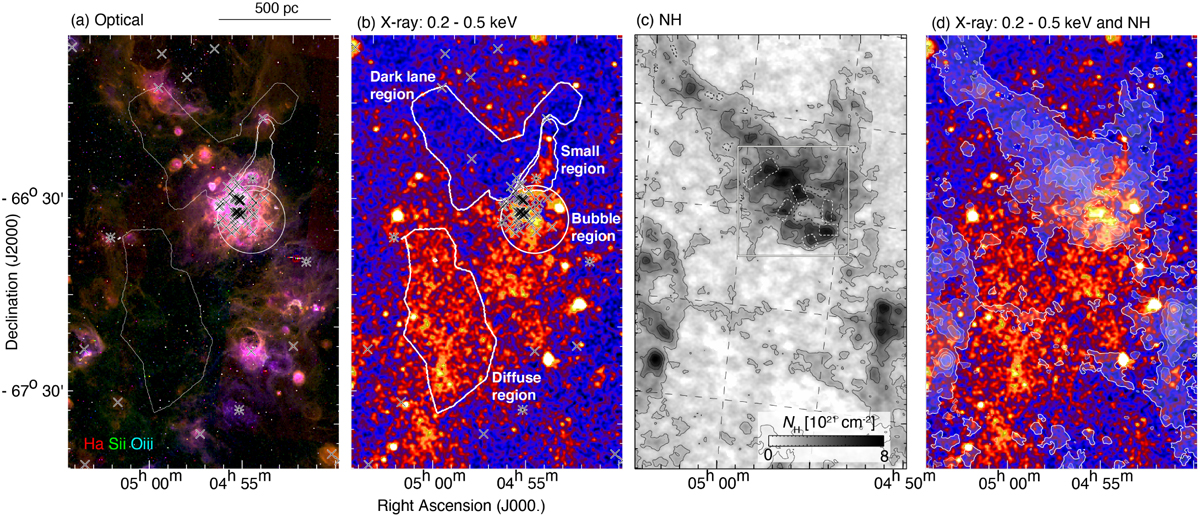
Spatial distribution of multiwavelength emissions within the N11 analysis region highlighted by white squares in Figs. 2 and 1. (a) Optical three-color image with Hα (red), [SII] (green), and [OIII] (blue) (Smith et al. 2005). (b) Soft X-ray emission (0.2–0.5 keV) toward the N11 source region. White lines show the four extraction regions of the spectra. Black crosses and asterisks are O-type stars and WR stars (Bonanos et al. 2009), respectively. (c) Spatial distribution of the total hydrogen column density NH. The contour levels are 1.5 × 10²¹, 3.0 × 10²¹, 4.5 × 10²¹, and 6.0 × 1021 cm−2. The white box indicates the region shown in Fig. 7. (d) The total hydrogen column density map by contours superposed on soft X-ray emission (0.2–0.5 keV).
Current usage metrics show cumulative count of Article Views (full-text article views including HTML views, PDF and ePub downloads, according to the available data) and Abstracts Views on Vision4Press platform.
Data correspond to usage on the plateform after 2015. The current usage metrics is available 48-96 hours after online publication and is updated daily on week days.
Initial download of the metrics may take a while.