Fig. 4
Download original image
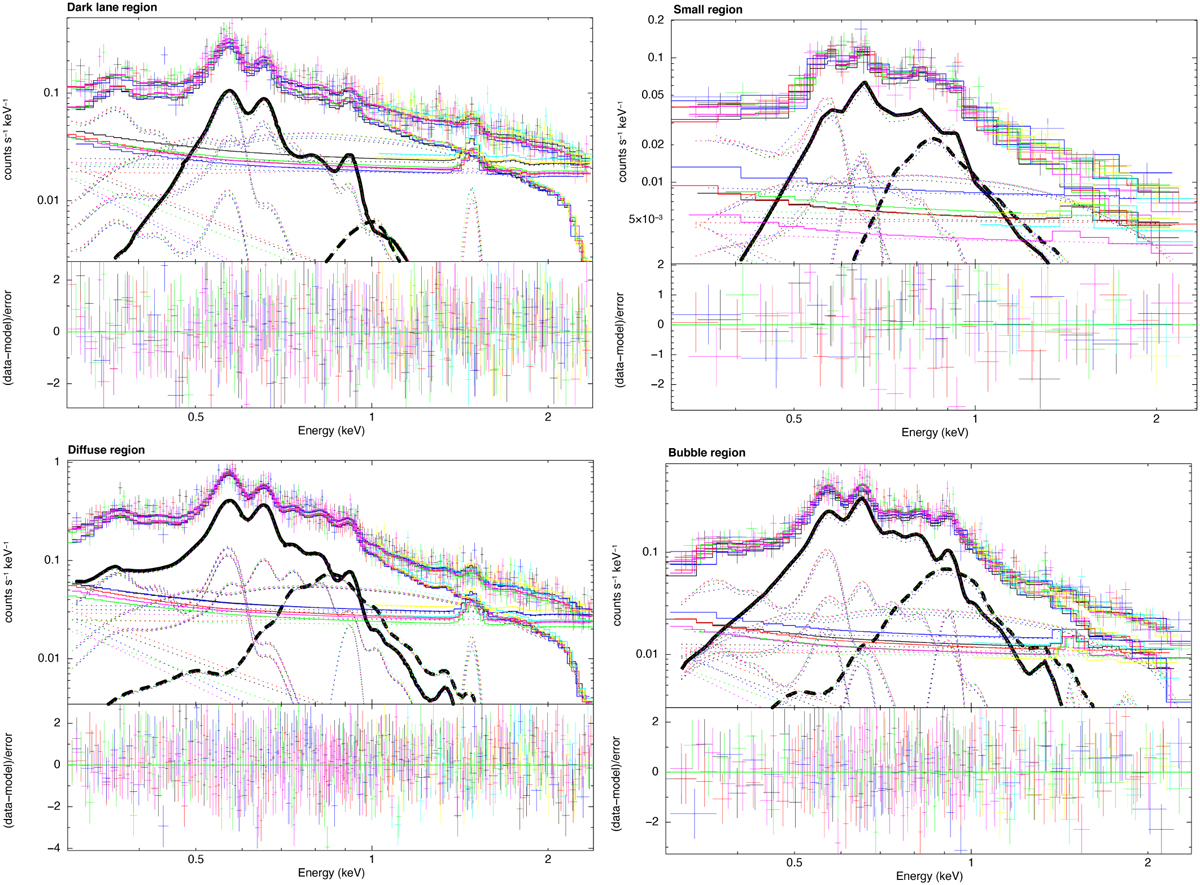
Spectra of four regions: in the dark lane region (upper left), the small region (upper right), the diffuse region (lower left), and inside of the N11 bubble (lower right). Spectra of all TMs are shown in different colors. The source components are highlighted with thick lines (solid: lower-temperature vapec1; dashed: higher-temperature vapec2). The straight lines show the particle background. The thin dotted lines indicate the spectral components of the astrophysical background spectrum.
Current usage metrics show cumulative count of Article Views (full-text article views including HTML views, PDF and ePub downloads, according to the available data) and Abstracts Views on Vision4Press platform.
Data correspond to usage on the plateform after 2015. The current usage metrics is available 48-96 hours after online publication and is updated daily on week days.
Initial download of the metrics may take a while.