Fig. 7
Download original image
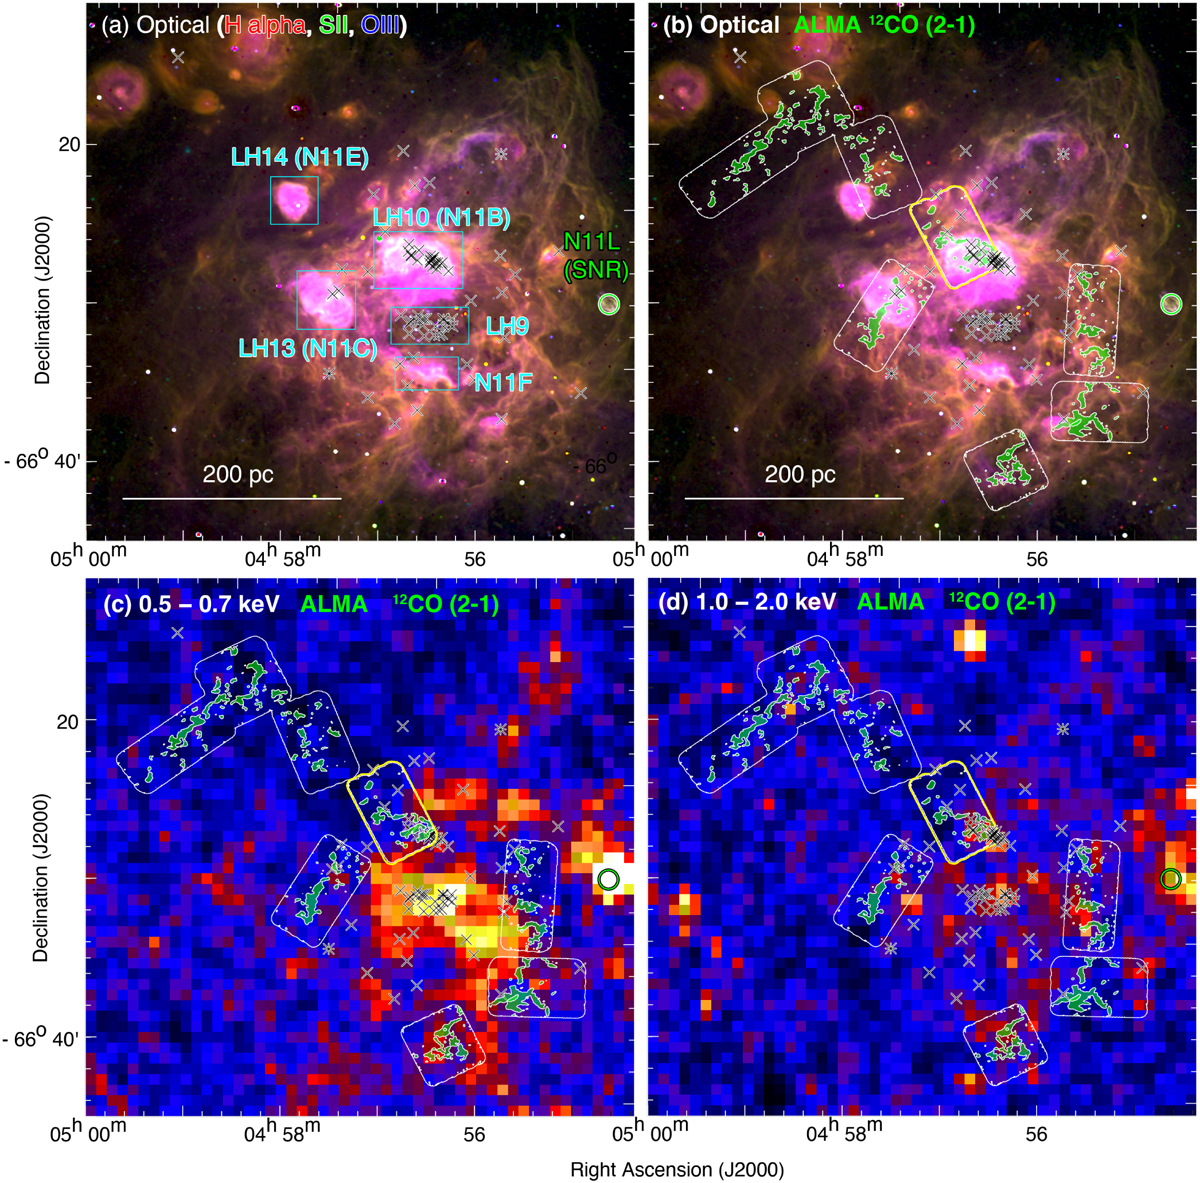
Multiwavelength emissions toward the Bubble region of N11 by ALMA and eROSITA. (a) Optical image with Hα (red), SII (green), and [OIII] (blue). (b) Spatial distributions of ALMA12CO (J = 2−1) in green overlaid with the optical image. The spatial distribution of X-ray emissions with a velocity range of (c) 0.5–0.7 keV and (d) 1.0–2.0 keV. The green circle is SNR N11L (Maggi et al. 2016). No other SNR is observed by the latest ASKAP radio data in the whole region (Bozzetto et al. 2023). The black crosses and asterisks are O-type stars and WR stars (Bonanos et al. 2009), respectively. The boxes in (b), (c), and (d) represent the observation areas of ALMA, with the yellow discussed in Sect. 5.1.4.
Current usage metrics show cumulative count of Article Views (full-text article views including HTML views, PDF and ePub downloads, according to the available data) and Abstracts Views on Vision4Press platform.
Data correspond to usage on the plateform after 2015. The current usage metrics is available 48-96 hours after online publication and is updated daily on week days.
Initial download of the metrics may take a while.