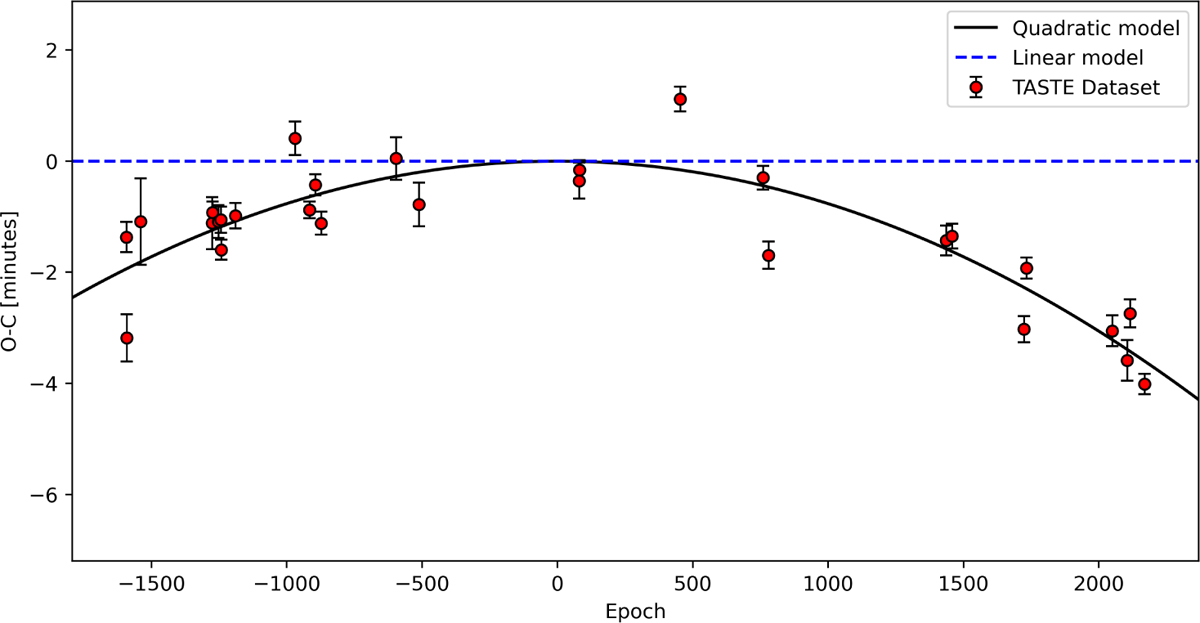
Fig. 1
Download original image
Observed minus calculated (O − C) diagram of WASP-12b for the unpublished transits collected at Asiago (Tables 1 and 3). The reference ephemeris here is the linear part of Eq. (3), while the additional quadratic term (based on dP/dE) is plotted as a black solid line. An excess scatter in the data points with respect to the quadratic model can be seen in the figure. This is addressed in Sect. 4.4.
Current usage metrics show cumulative count of Article Views (full-text article views including HTML views, PDF and ePub downloads, according to the available data) and Abstracts Views on Vision4Press platform.
Data correspond to usage on the plateform after 2015. The current usage metrics is available 48-96 hours after online publication and is updated daily on week days.
Initial download of the metrics may take a while.