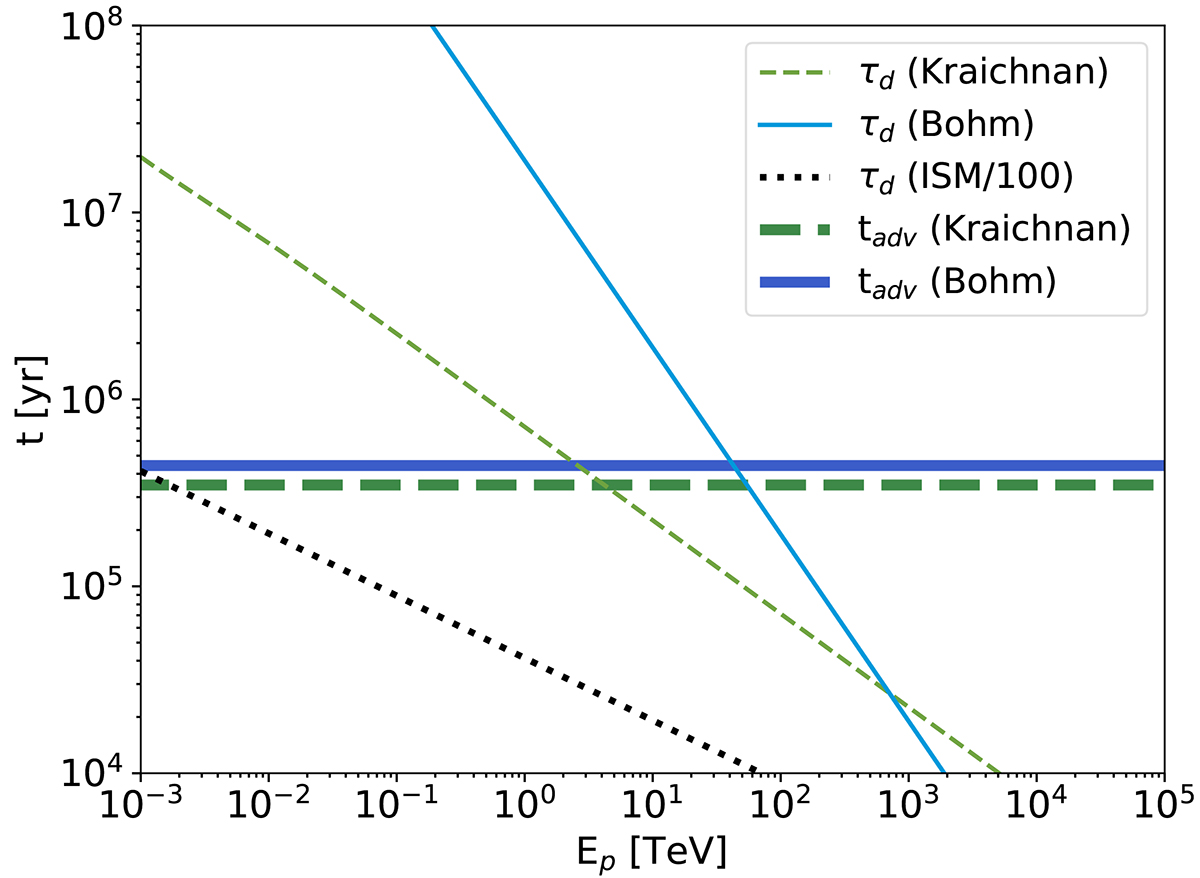
Fig. 6.
Download original image
Comparison between diffusion (thin lines) and advection (thick lines) timescales for the Kraichnan (green dashed lines) and Bohm (blue solid lines) cases. The black dotted line shows the diffusion time in the case of a diffusion coefficient with the same slope as that in the standard interstellar medium normalised a factor of 100. All timescales are calculated considering only the region used for the morphological analysis, i.e. substituting Rb with 54 pc in Eqs. (20) and (21).
Current usage metrics show cumulative count of Article Views (full-text article views including HTML views, PDF and ePub downloads, according to the available data) and Abstracts Views on Vision4Press platform.
Data correspond to usage on the plateform after 2015. The current usage metrics is available 48-96 hours after online publication and is updated daily on week days.
Initial download of the metrics may take a while.