Fig. 13
Download original image
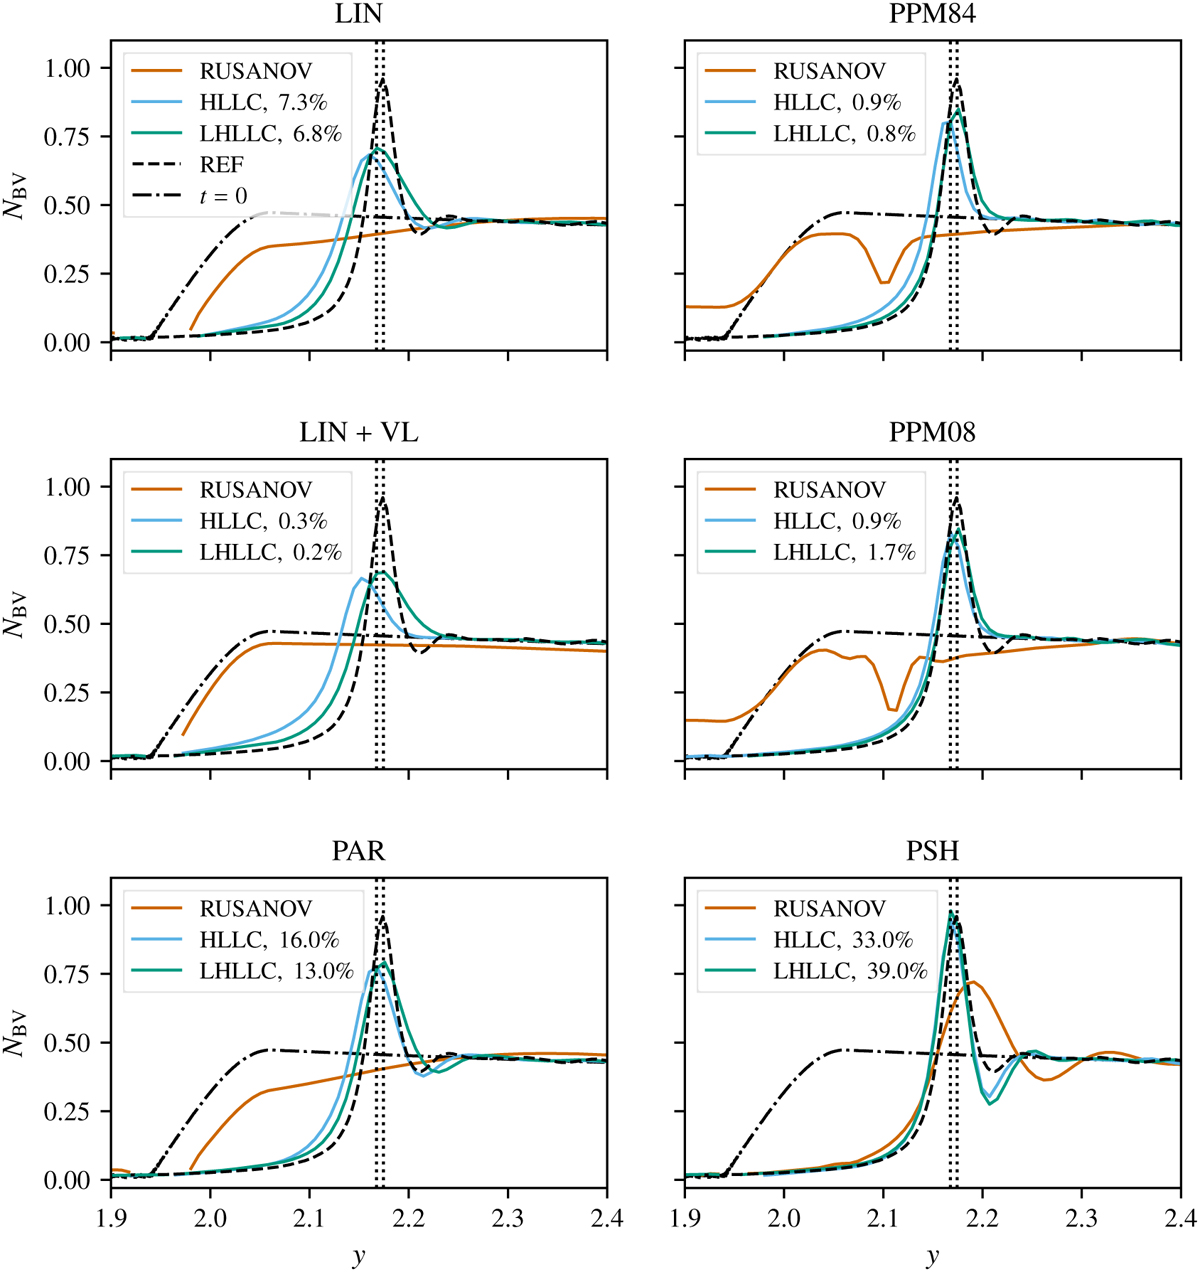
Vertical profiles of the Brunt-Väisälä frequency (NBV) averaged over the time interval t ∈ (30τconv, 32τconv) in the problem of turbulent convection and wave excitation. Each panel shows the results of simulations run using the same reconstruction scheme but different Riemann solvers. Here, we only show results from the 2563 grid to avoid cluttering the figures. The reference run (REF) is represented by a black dashed line. The black dash-dotted line is the profile of the Brunt-Väisälä frequency at t = 0, and the vertical black dotted lines represent the position of the convective boundary at the beginning and the end of the chosen averaging time interval in the reference run, y = 2.168 and y = 2.174, respectively. The percentages shown in the insets for simulations run with the HLLC and LHLLC solvers represent the amplitude of the largest undershoot in NBv relative to NBV,t=0, in the spatial range y ∈ (2.15, 2.40). The amplitude of the largest undershoot in the reference run is 12%.
Current usage metrics show cumulative count of Article Views (full-text article views including HTML views, PDF and ePub downloads, according to the available data) and Abstracts Views on Vision4Press platform.
Data correspond to usage on the plateform after 2015. The current usage metrics is available 48-96 hours after online publication and is updated daily on week days.
Initial download of the metrics may take a while.