Fig. 15
Download original image
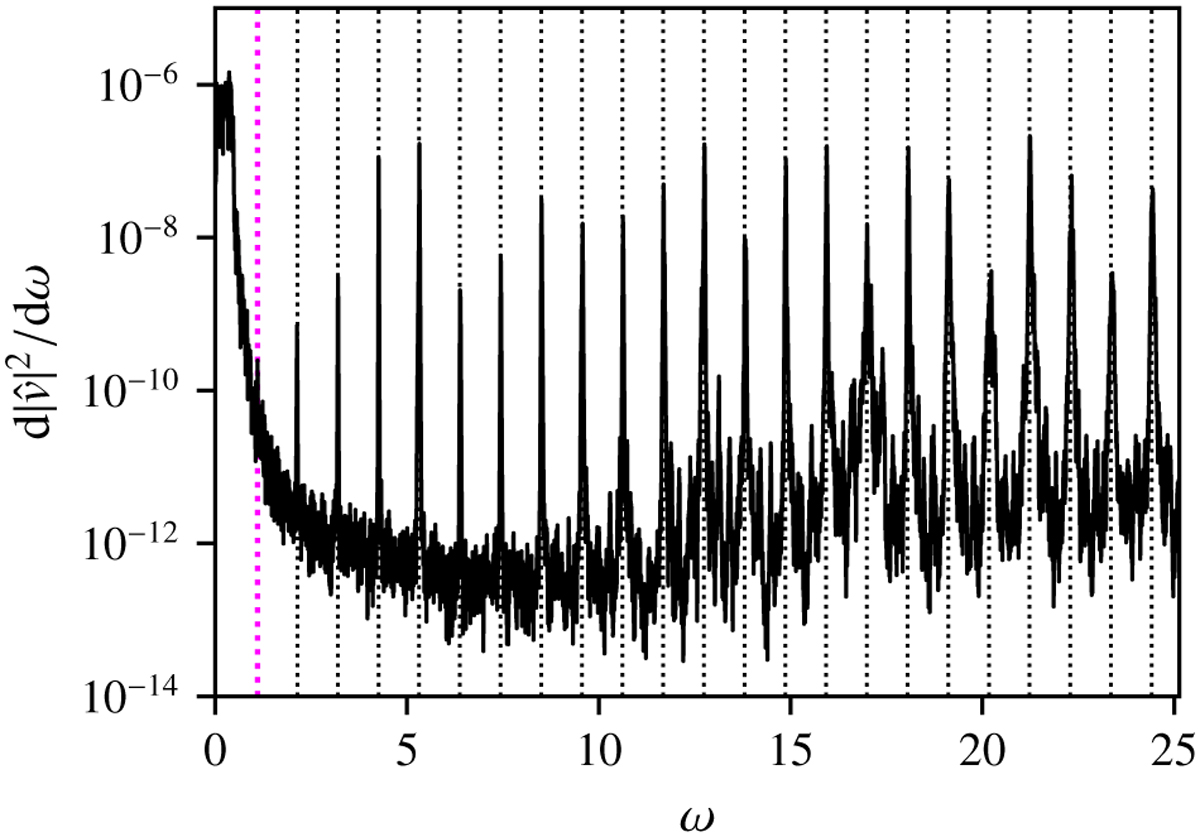
Frequency power spectrum of ν as in Fig. 14 but showing only the results of PPM08 + HLLC on the 2563 grid. The vertical black dotted lines represent the resonant modes of the cavity which we derived from the theory of linear oscillations in Cowling approximation (see, e.g., Aerts 2021). The pink line at ω = 1.1 is the frequency of the fundamental oscillation mode of the cavity.
Current usage metrics show cumulative count of Article Views (full-text article views including HTML views, PDF and ePub downloads, according to the available data) and Abstracts Views on Vision4Press platform.
Data correspond to usage on the plateform after 2015. The current usage metrics is available 48-96 hours after online publication and is updated daily on week days.
Initial download of the metrics may take a while.