Fig. C.1
Download original image
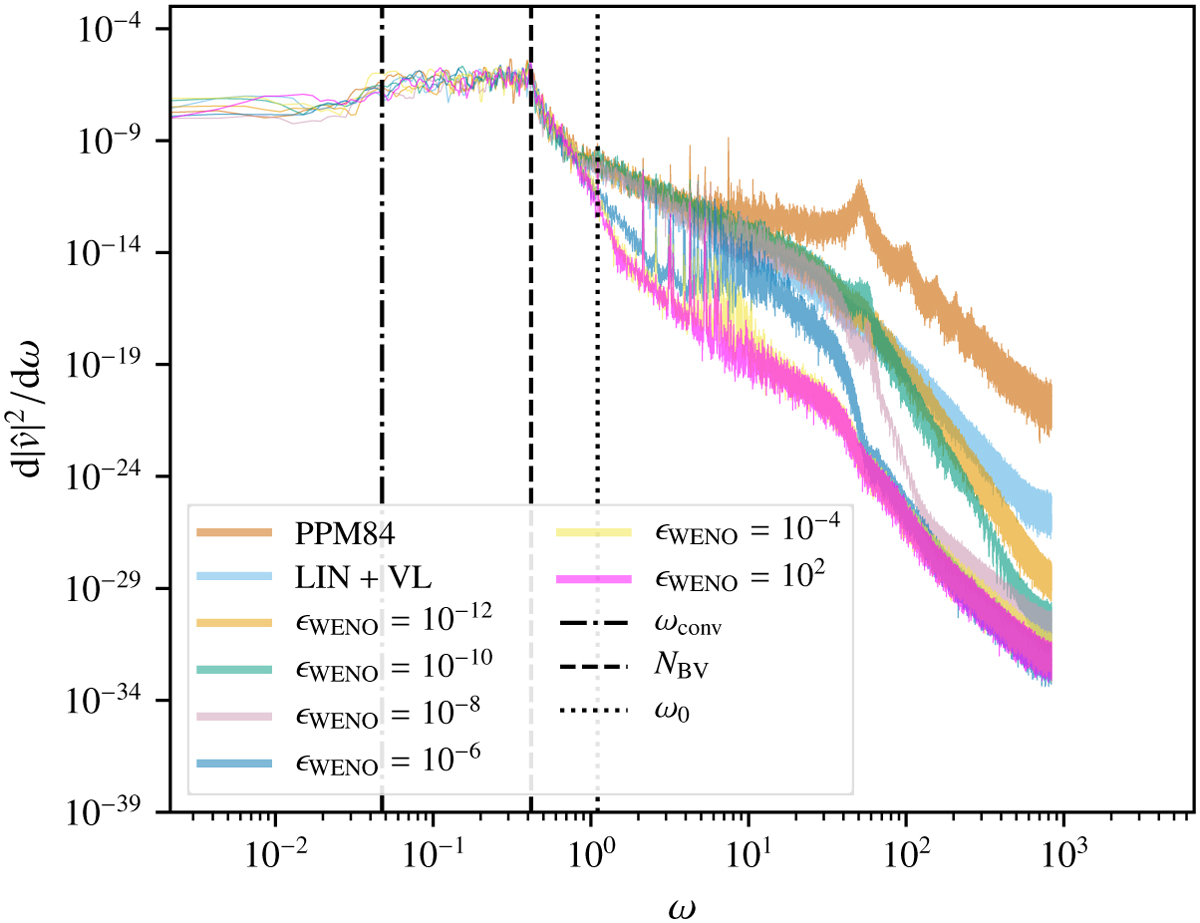
Frequency power spectrum of the vertical velocity component υ extracted in the middle of the stable layer at (x, y, z) = (−0.2, 2.5, −0.2) over the time series t ∈ (10τconv, 32τconv) in the problem of turbulent convection and wave excitation described in Sec. 3.2. These results are obtained on a grid with 1283 cells, using the LHLLC Riemann solver and the CTO-WENO scheme of Kolb (2014) for different values of the parameter ε WENO occurring in the smoothness indicators of the scheme (see Sect. C), ranging from 10−12 to 102. As a reference, power spectra obtained with the numerical options LHLLC + PPM84 and LHLLC + LIN + VL are also shown. The convective turnover frequency (ωconv = 2π/τconv), the Brunt-Väisälä frequency at the location of the point probe (NBV), and the frequency of the fundamental oscillation mode of the cavity (ω0 = 1.1) are represented by the black dashed-dotted, dashed, and dotted lines, respectively.
Current usage metrics show cumulative count of Article Views (full-text article views including HTML views, PDF and ePub downloads, according to the available data) and Abstracts Views on Vision4Press platform.
Data correspond to usage on the plateform after 2015. The current usage metrics is available 48-96 hours after online publication and is updated daily on week days.
Initial download of the metrics may take a while.